CDash:Documentation: Difference between revisions
| (76 intermediate revisions by 2 users not shown) | |||
| Line 1: | Line 1: | ||
[[CDash | < CDash Main Page]] | |||
This page is the official CDash documentation. | This page is the official CDash documentation. | ||
| Line 14: | Line 16: | ||
= Login to CDash = | = Login to CDash = | ||
CDash uses secure login for users and adminsitrators. CDash does not store any plain text passwords in the database, therefore passwords cannot be recovered, even by system administrators. LDAP is not currently supported | CDash uses secure login for users and adminsitrators. CDash does not store any plain text passwords in the database, therefore passwords cannot be recovered, even by system administrators. | ||
''Note: LDAP is not currently supported.'' | |||
* To login, click on the 'Login' link at the top of the main CDash page or directly go to the user.php page http://myserver/CDash/user.php. | * To login, click on the 'Login' link at the top of the main CDash page or directly go to the user.php page http://myserver/CDash/user.php. | ||
* If you don't have a login, click on the 'register' link on the top menu. In order to register, CDash requires a valid email address, your first name, last name and password. The institution is optional. CDash implements some security features to avoid robots to register. | * If you don't have a login, click on the 'register' link on the top menu. In order to register, CDash requires a valid email address, your first name, last name and password. The institution is optional. CDash implements some security features to avoid robots to register. | ||
* Once | * Once registered you are ready to type your email and password provided in the login screen. | ||
* The | |||
= Available Dashboards = | |||
[[Image:CDashIndexTable.jpg|thumb|CDash index table]] | |||
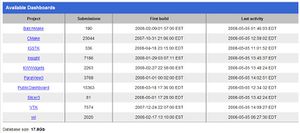
The first page display on CDash is a list of current public projects (private projects are not shown on this page). Several information are shown on this page: | |||
* The name of the project | |||
* The total number of submissions for each project | |||
* The date of the first build for each project | |||
* The date of the last submission (not build time) | |||
* To total size of the database | |||
Clicking on the name of the project redirects the user to the main dashboard for this project. | |||
= Project Dashboard = | |||
[[Image:CDashMainDashboard.jpg|thumb|Project's dashboard page]] | |||
[[Image:CDashHelp.jpg|thumb|Help link from the main dashboard page]] | |||
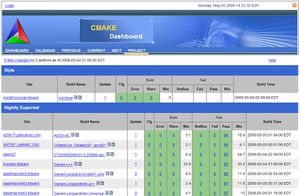
Each project dashboard have a similar layout: | |||
* Top row of the page: | |||
** Link to "My CDash/Login" | |||
** Current date of the server hosting CDash | |||
** Link to RSS feed to the project (if not private) | |||
* Banner: | |||
** Custom project logo (see [[CDash:Administration#Updating_project.E2.80.99s_logo | Updating project's logo]] to upload a new logo). ''Note: clicking on the logo redirects to the project's home page (if any defined)'' | |||
** Project's name | |||
* Main Menu | |||
** '''Dashboard:''' goes back to the list of projects hosted on CDash | |||
*** '''Updates:''' Overview of the updates for this day and this project | |||
*** '''Builds:''' Overview of the builds for this day and this project | |||
*** '''Tests:''' Overview of the test failing for this day and this project | |||
*** '''Map:''' Map of the sites for this project and this day | |||
** '''Calendar:''' display a calendar to check previous dashboards | |||
** '''Previous:''' Go to the previous day | |||
** '''Current:''' Go to the current day | |||
** '''Next:''' Go to the next day | |||
** '''Project:''' Project links | |||
*** '''Home:''' Home URL | |||
*** '''Doxygen:''' Documentation page for this project | |||
*** '''CVS:''' Link to the CVS/SVN viewer for this project | |||
*** '''Bugs:''' Link to the bug tracker for this project | |||
* '''Daily updates:''' Updates on the project's repository. | |||
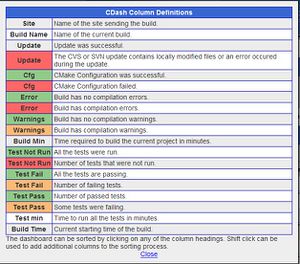
* '''Help link:''' popup a window with help information | |||
* Build groups: explained in the next section. | |||
* Coverage: explained in the next section. | |||
* Dynamic Analysis: explained in the next section. | |||
== Build groups == | |||
Each build submitted by a site corresponds to a row in the main dashboard. By default the build falls in the group defined by the type of submission (i.e Nightly, Experimental or Continuous), however, custom builds can be defined. See [[CDash:Administration#Build_Groups | Build Groups]] administration section for more information on how to create new groups and define rules for builds. | |||
* Mouse hover the top row of a build group, shows the quick link bar to quickly jump to a different group. | |||
* Expected builds are shown as a empty row in the dashboard if they have not been submitting. | |||
=== Default group === | |||
[[Image:CDashSorting.jpg|thumb|Muli-columns sorting]] | |||
[[Image:CDashGroup.jpg|thumb|Group description]] | |||
[[Image:CDashShowNote.jpg|thumb|Note for a build]] | |||
In this section we explain the layout of default groups (i.e. Nightly, Experimental, Continuous,...). These groups are represented in the light blue sections. | |||
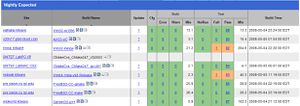
'''Clicking on the gray header allow sorting the table by the clicked field. Multisorting is possible by holding the shift key.''', also the current sorting is saved by the user's web browser using cookies, allowing to keep the same sorting while browsing different days for the same project. | |||
Clicking on the group name displays the build group description. | |||
Each build (row) contains the following information: | |||
* '''Site:''' Name of the site submitting the build. Clicking on the name redirects to site description. | |||
* '''Build name:''' Name of the build. Clicking on the name redirects to the build summary page. | |||
** '''Build note:''' If submitted with CTest and configure with build notes, a small icon shows the build note. Clicking on the icon displays the CTest script used to submit the page. | |||
** '''CTest version:''' If submitted with CTest, a small icon displays the CTest version. | |||
** '''Build info:''' If a build is expected and has not been submitting, or if a build has errors or warnings or tests failing, then a build info icon is present. Clicking on the build info icon trigger an ajax request that displays more information about this build. | |||
** '''Notes:''' If someone submitted a note for this build, mouse hover the note icon will display the current notes. | |||
* '''Update:''' Shows the number of files updated (from the SVN/CVS repository) for this build. Clicking on the number shows the name and information of the updated files. | |||
* '''Cfg:''' Shows the configuration errors. If red, some errors occurred while configuring the project. Clicking on the number displays the current configuration status. | |||
* '''Build:''' Displays the principal build information. | |||
** '''Error:''' Number of build errors. | |||
** '''Warn:''' Number of build warnings. | |||
** '''Min:''' Time (in minutes) it took to build the project. | |||
* '''Test:''' Displays information about the test. | |||
** '''Not Run:''' Number of test not run (because not found for instance). | |||
** '''Fail:''' Number of test failed. Clicking on the number show the name of the failing tests. If time status is enabled for the project, it is reflected here. | |||
** '''Pass:''' Number of test passed. Clicking on the number show the name of the passing tests. If time status is enabled for the project, it is reflected here. | |||
** '''Min:''' Time it took to run all the tests. | |||
* '''Build time:''' Time when the build started expressed in the timezone of the webserver. This is different from the time when the build was submitted. | |||
=== Coverage === | |||
[[Image:CDashCoverage.jpg|thumb|Coverage section of the dashboard]] | |||
CDash supports gcov and bullseye as coverage tools. | |||
The main dashboard displays the following information: | |||
* | * '''Site:''' name of the site | ||
* | * '''Build name:''' name of the build | ||
* | * '''Percentage: ''' Overall coverage percentage (for all files in the project). | ||
* '''Passed:''' Number of lines of code that are tested. | |||
* '''Failed:''' Number of lines of code that are not tested. | |||
* '''Date:''' Build starting date. | |||
* | |||
* | |||
* | |||
= | === Dynamic Analysis === | ||
[[Image:CDashDynamicAnalysis.jpg|thumb|Dynamic Analysys section of the dashboard]] | |||
== | |||
CDash supports [http://valgrind.org valgrind] as the main dynamic analysis tool. | |||
The main dashboard displays the following information: | |||
* '''Site:''' Name of the site | |||
* '''Build name:''' Name of the build | |||
* '''Checker: ''' Name of the checker. | |||
* '''Defect count:''' Number of memory defects. | |||
* '''Date:''' Build starting date. | |||
== Daily updates == | |||
CDash stores the daily updates in the database for a quick query. The number of files changed for that day as well as the number of authors who changed the files are displayed. Clicking on the number of files changed display the name of the files and more information. | |||
See the [[CDash:Design#Daily_Updates | Daily Updates Design]] section for more information. | |||
== Map == | |||
[[Image:CDashMap.jpg|thumb|Map of the sites contributing to a project]] | |||
CDash stores the geolocation from the IP address for the sites and displays them on a map via Google map API. This allows to quickly browse where the builds are coming from. Clicking on a pin on the map, shows the name of the site. | |||
See [[CDash:Design#Map_and_Geolocation | Map and Geolocation]] design page for more information. | |||
= | = My CDash = | ||
[[Image:CDashMyCDash.jpg|thumb|MyCDash page]] | |||
CDash | Each user has its own personal section in CDash, where they can keep track of recent builds, submissions, claim sites and more. | ||
== My Profile == | |||
User can change their profile: First/Last name, email, institution and password from the the "My Profile" menu at the top of the "My CDash" page. | |||
== My Projects == | |||
If a user has subscribe to at least a project (see [[CDash:Documentation#Subscribe_to_project | Subscribe to project]]), the list of subscribed projects is shown under "My Projects". There several links related to the subscriptions. | |||
=== Edit Subscription === | |||
Users can edit their subscription for a given project. | |||
# From MyCdash page, under My Projects, click on [Edit subscription] | |||
# Change the role if necessary. '''Downgrading from project administrator to Site maintainer or normal user cannot be reverted unless by another project administrator'''. | |||
# Change or add CVS/SVN login | |||
# Change the email preferences if necessary | |||
# Click on "Update Subscription" to validate the modifications | |||
Users can unsubscribe from a project by clicking on the "Unsubscribe" button. Users will be able to subscribe later on. | |||
=== Claim sites === | |||
See [[CDash:Documentation#Claim a site | Claim a site]] section. | |||
== | === Edit project === | ||
See [[CDash:Administration#Editing_a_project | Editing a project]] section. | |||
=== Manage project groups === | |||
# | See [[CDash:Administration#Build_Groups | Build groups]] section. | ||
=== Manage project roles === | |||
See [[CDash:Administration#Project_Roles | Project roles]] section. | |||
== | == My Sites == | ||
[[Image:CDashMySites.jpg|thumb|My sites]] | |||
As a site maintainer, it is useful to know if submissions have been missing for quite sometime, or if the current builds on a specific sites are not reporting errors due to misconfiguration. | |||
== | * The first column show the list of currently claimed sites. | ||
* The first row shows the current projects that are submitting builds for the given site | |||
* For each pair (site/project) a summary of the current status of the dashboard is displayed | |||
{| border="1" | |||
|- bgcolor="#abcdef" | |||
! Build group !! Updates !! Errors !! Warnings !! Tests !! Last submission | |||
|- | |||
| N: Nightly || 1 || 0 || 0 || 0 || Today | |||
|- | |||
| C: Continuous || 1 || 0 || 0 || 0 || Yesterday | |||
|- | |||
| E: Experimental || 1 || 0 || 0 || 0 || 6 days ago | |||
|} | |||
''Note: only Nightly, Continuous and Experimental groups are current shown'.' | |||
Clicking on the name of a site gives access to the description of the site. | |||
== Public projects == | |||
CDash | List of all the public projects stored in CDash. By definition, users registered in CDash can subscribe to any public projects. | ||
= | = Subscribe to project = | ||
[[Image:CDashSubscribeProject.jpg|thumb|Subscribing to public projects]] | |||
If the project is public then users can subscribe to the project themselves, otherwise see section [[CDash:Administration#Project_Roles | Project Roles]]. | |||
# | |||
# Log into CDash (see [[CDash:Documentation#Login_to_CDash | Login to CDash]]) | |||
# Under "Public projects" section click on [Subscribe to this project] | |||
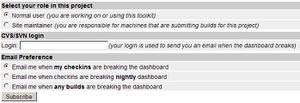
# Select your role for the project: '''Normal user''' or '''Site maintainer''' if you are responsible for a machine sending periodic builds to the dashboard/ | |||
# Add your CVS/SVN login for the project if you have any | |||
# Select your email preference | |||
# Click on subscribe | |||
= Claim a site = | |||
[[Image:CDashClaimSite.jpg|thumb|Claiming a site]] | |||
CDash allows '''Site maintainers''' (see [[CDash:Documentation#Subscribe_to_project | Subscribe to Project]]) to claim a site they are managing. This allows users to have personal reports regarding a specific machine and get informed if the machine has not been submitting from quite some time or has unexpected high number of failures (probably due to misconfiguration). | |||
In order to claim a site: | |||
# Login to CDash to acces "My CDash" | |||
# Under "My Projects" select [Claim sites]. If the project is not listed, refers to [[CDash:Documentation#Subscribe_to_project | Subscribe to Project]] for more information. | |||
# The Claim sites page show the list of current sites for the project. Check the site(s) of interest. | |||
# Click on "Update claimed sites" | |||
In order to unclaim a site: | |||
CDash | # Login to CDash to acces "My CDash" | ||
# Under "My Projects" select [Claim sites]. | |||
# Uncheck the site(s) no longer of interest. | |||
# Click on "Update claimed sites" | |||
See the section [[CDash:Documentation#Describe_a_site | Describe a site]] for information about the given sites. | |||
= Describe a site = | |||
[[Image:CDashSiteSpecifications.jpg|thumb|Describing a site]] | |||
[[Image:CDashSite.jpg|thumb|Site information]] | |||
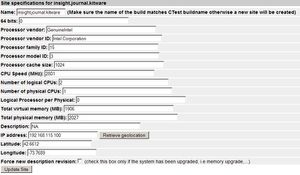
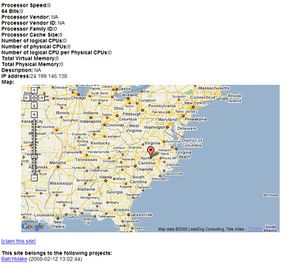
CDash records each site specifications so that users can quickly assess the type of machine, OS, memory, etc... | |||
'''If using the CTest 2.6 (or higher) the site specifications are automatically sent as part of the submission.''' | |||
Here's the list of specification currently present: | |||
*'''Name:''' '''This value shouldn't be changed, unless the site name sent by the build was wrong. Make sure the name of the build matches CTest buildname otherwise a new site will be created.''' | |||
*'''64 bits:''' Is the machine running a 64bits OS | |||
*'''Processor vendor:''' vendor name of the processor (i.e. GenuineIntel) | |||
*'''Processor vendor ID:''' vendor identification of the processor (i.e. Intel Corporation) | |||
*'''Processor family ID:''' family identification number of the processor (i.e. 15) | |||
*'''Processor model ID:''' model identification number of the processor, usually depending on the processor family (i.e. 3) | |||
*'''Processor cache size:''' size of the processor cache in MB. | |||
*'''CPU Speed (MHz):''' speed of the CPU in MHz. | |||
*'''Number of logical CPUs:''' Number of logical CPU per physical CPU. | |||
*'''Number of physical CPUs:''' Number of physical CPU. | |||
*'''Logical Processor per Physical:'''Number of logical processor per physical | |||
*'''Total virtual memory (MB):''' Total virtual memory in MB. | |||
*'''Total physical memory (MB):''' Total physical memory (RAM) in MB. | |||
*'''Description:''' Description of the machine. | |||
*'''IP address:''' Current IP address. This is filled in automatically by CDash | |||
*'''Latitude:''' Geolocation from the IP address | |||
*'''Longitude:''' Geolocation from the IP address | |||
'''CDash keeps an history''' of the machine description, in case of memory or processor upgrade. This is particularly useful to assess why a test is now running much faster than before. If the system has been upgraded, the checkbox "Force new description revision" should be checked. Note that CDash should automatically detect if a site has been upgraded. | |||
Note | |||
''Note: support for other specifications, such as graphic card information and more detailed information might be added in the near future.'' | |||
= Graphs = | |||
CDash relies on the flot javascript library for graphing. See the section [[CDash:Design#Graphs | Graphs]] for information. | |||
CDash curently plots three types of graph as explained below. | |||
= | == Build time graph == | ||
[[Image:CDashBuildGraph.jpg|thumb|Build time graph]] | |||
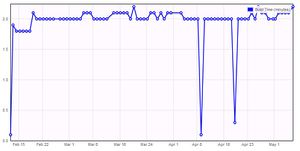
The time requires to build a project is recorded as part of CTest. Sometimes it might be useful to track the build time overtime. In order to do so: | |||
# | # Go to the main dashboard for the project | ||
# Click on | # Click on the build name you want to track | ||
# On the build summary page, click on [Show Build Time Graph], this performs an Ajax request to the database. | |||
# | |||
== Test time graphs == | |||
CDash plots graphs of the time it takes to run a specific test as well as its status (passed/failed) overtime. | |||
To look at these graphs: | |||
# Go to the main dashboard for a project | |||
# Click on the number of test passed or failed | |||
# From the list of tests, click on the status of the test. | |||
# Click on [Show Test Time Graph] and/or [Show Failing/Passing Graph] | |||
== | = Adding notes to a build = | ||
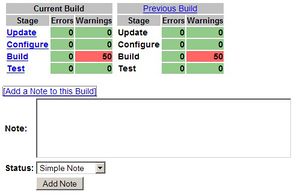
[[Image:CDashAddNote.jpg|thumb|Adding a note to a build]] | |||
In some cases, it is useful to tell other developers that you are currently looking at the errors for a builds and informed them. CDash implements a simple note mechanism. | |||
* Login to CDash | |||
* On the dashboard project page, click on the build name to which you want to add the note. | |||
* Click on [Add a Note to this Build] link, located next to the current build matrix (see thumbnail) | |||
* Enter a small message corresponding to the note | |||
* Select the status of the note: '''Simple note''', '''Fix in progress''', '''Fixed'''. | |||
* Click on "Add Note" | |||
= Build summary = | |||
CDash summarizes the build errors and warnings on a single page. The errors are grouped by file and line number. It makes easier to fix source code. | |||
In order to see the build summary: | |||
# Go to the main dashboard for the project | |||
# In the main menu select Dashboard->Builds | |||
== | = Filters = | ||
Some CDash pages allow you to use '''filters''' to narrow down the results to what's important to you. | |||
== Filters on index.php == | |||
{| border="1" | |||
|- bgcolor="#abcdef" | |||
! Name !! Description !! Example Value | |||
|- | |||
| Build Duration || How long the build took to complete || 14m 58s | |||
|- | |||
| Build Errors || How many errors occurred during the build step || 1 | |||
|- | |||
| Build Warnings || How many warnings occurred during the build step || 5 | |||
|- | |||
| Build Name || The name of the build || Linux-cxx | |||
|- | |||
| Build Stamp || The CTest-generated TAG for this build || 20090223-0100-Nightly | |||
|- | |||
| Build Start Time || When this build started (including any update/configure/etc) || 2009-02-23 01:00:00 UTC | |||
|- | |||
| Build Type || What type of build this is || Experimental | |||
|- | |||
| Configure Duration || How long this build took to configure || 2m 45s | |||
|- | |||
| Configure Errors || How many errors occurred during the configure step || 2 | |||
|- | |||
| Configure Warnings || How many warnings occurred during the configure step || 3 | |||
|- | |||
| Expected || Whether or not this build has been marked as expected || true | |||
|- | |||
| Group || The name of this build's group || Nightly | |||
|- | |||
| Has Coverage || Whether or not this build performed coverage || true | |||
|- | |||
| Has CTest Notes || Whether or not any notes were uploaded with this build || false | |||
|- | |||
| Has Dynamic Analysis || Whether or not this build performed dynamic analysis || true | |||
|- | |||
| Has User Notes || Whether or not a CDash user left a note on this build || true | |||
|- | |||
| Label || Search for builds with a given label || vtkCommonCore | |||
|- | |||
| Revision || The version of the source code that was built (git SHA1, SVN version, etc) || e19dbfa | |||
|- | |||
| Site || Search for builds from a given site || kamino | |||
|- | |||
| Submission Client || What client was used to submit this build || ctest-3.0 | |||
|- | |||
| SubProjects || Whitelist or blacklist SubProject results || my-subproject-name | |||
|- | |||
| Tests Duration || How long this build took to test || 5m 23s | |||
|- | |||
| Tests Failed || How many tests failed || 4 | |||
|- | |||
| Tests Not Run || How many tests couldn't be run || 10 | |||
|- | |||
| Tests Passed || How many tests passed || 20 | |||
|- | |||
| Tests Timing Failed || [[CDash:Design#Test_Timing|How many tests failed the time status check]] || 8 | |||
|- | |||
| Update Duration || How long this build took to update || 45s | |||
|- | |||
| Updated Files || How many source files were updated before this build || 5 | |||
|} | |||
== Filters on queryTests.php == | |||
{| border="1" | |||
|- bgcolor="#abcdef" | |||
! Name !! Description !! Example Value | |||
|- | |||
| Build Name || The name of the build that performed this test || Linux-c++ | |||
|- | |||
| Build Start Time || When this build started (including any update/configure/etc) || 2009-02-23 01:00:00 UTC | |||
|- | |||
| Details || Information about how this test exited || OTHER_FAULT | |||
|- | |||
| Label || Search for tests with a given label || vtkCommonCore | |||
|- | |||
| Site || Search for tests run on a given site || kamino | |||
|- | |||
| Status || Search for tests with a given status || passed | |||
|- | |||
| Test Name || The name of the test || kwsys.testHashSTL | |||
|- | |||
| Time || How long this test took to run (in seconds) || 12.73 | |||
|} | |||
== Filters on testOverview.php == | |||
{| border="1" | |||
|- bgcolor="#abcdef" | |||
! Name !! Description !! Example Value | |||
|- | |||
| Build Name || The name of the build(s) whose tests you're interested in || Linux-c++ | |||
|} | |||
== | == Filters on viewCoverage.php == | ||
{| border="1" | |||
|- bgcolor="#abcdef" | |||
! Name !! Description !! Example Value | |||
|- | |||
| Covered Lines || The number of covered lines in this file || 50 | |||
|- | |||
| Filename || The name of this file || foo.cxx | |||
|-| Labels || Search for source files with a given label || vtkCommonCore | |||
|- | |||
| Priority || The priority of this source file || 2 | |||
|- | |||
| Total Lines || The number of coverable lines in this file || 100 | |||
|- | |||
| Uncovered Lines || The number of uncovered lines in this file || 25 | |||
|} | |||
== Filters on viewTest.php == | |||
{| border="1" | |||
|- bgcolor="#abcdef" | |||
! Name !! Description !! Example Value | |||
|- | |||
| Details || Information about how this test exited || OTHER_FAULT | |||
|- | |||
| Label || Search for tests with a given label || vtkCommonCore | |||
|- | |||
| Status || Search for tests with a given status || passed | |||
|- | |||
| Test Name || The name of the test || kwsys.testHashSTL | |||
|- | |||
| Time || How long this test took to run (in seconds) || 12.73 | |||
|- | |||
| Time Status || [[CDash:Design#Test_Timing|Whether or not this build failed the time status check]] || 1 | |||
|} | |||
Latest revision as of 17:50, 27 October 2016
This page is the official CDash documentation.
CDash definitions
- Build: Single submission to the dashboard for a specific project, environment and build type.
- Build type: reference by CTest as Nightly, Experimental or Continuous. (see CMake documentation for more information).
- Site: Computer contributing builds to the dashboard. A site might belong to several projects and submit different build.
- Coverage: Number of lines of code actually tested. CDash/CTest currently supports gcov and bulleyes tools.
- Dynamic Analysis: reports the memory allocation/deallocations analysis for test, examples and executable for the project. Valgrind is currently supported by CTest/CDash.
- Nightly start time: starting time of the 24h window of the daily dashboard.
- Ajax: Asynchronous JavaScript and XML, is a group of web development techniques used for creating interactive web applications.
- PHP: Hypertext Preprocessor, is a computer scripting language, designed for producing dynamic web pages.
- SQL: Structured Query Language, is a database computer language designed for the retrieval and management of data in relational database management systems.
Login to CDash
CDash uses secure login for users and adminsitrators. CDash does not store any plain text passwords in the database, therefore passwords cannot be recovered, even by system administrators.
Note: LDAP is not currently supported.
- To login, click on the 'Login' link at the top of the main CDash page or directly go to the user.php page http://myserver/CDash/user.php.
- If you don't have a login, click on the 'register' link on the top menu. In order to register, CDash requires a valid email address, your first name, last name and password. The institution is optional. CDash implements some security features to avoid robots to register.
- Once registered you are ready to type your email and password provided in the login screen.
Available Dashboards
The first page display on CDash is a list of current public projects (private projects are not shown on this page). Several information are shown on this page:
- The name of the project
- The total number of submissions for each project
- The date of the first build for each project
- The date of the last submission (not build time)
- To total size of the database
Clicking on the name of the project redirects the user to the main dashboard for this project.
Project Dashboard
Each project dashboard have a similar layout:
- Top row of the page:
- Link to "My CDash/Login"
- Current date of the server hosting CDash
- Link to RSS feed to the project (if not private)
- Banner:
- Custom project logo (see Updating project's logo to upload a new logo). Note: clicking on the logo redirects to the project's home page (if any defined)
- Project's name
- Main Menu
- Dashboard: goes back to the list of projects hosted on CDash
- Updates: Overview of the updates for this day and this project
- Builds: Overview of the builds for this day and this project
- Tests: Overview of the test failing for this day and this project
- Map: Map of the sites for this project and this day
- Calendar: display a calendar to check previous dashboards
- Previous: Go to the previous day
- Current: Go to the current day
- Next: Go to the next day
- Project: Project links
- Home: Home URL
- Doxygen: Documentation page for this project
- CVS: Link to the CVS/SVN viewer for this project
- Bugs: Link to the bug tracker for this project
- Dashboard: goes back to the list of projects hosted on CDash
- Daily updates: Updates on the project's repository.
- Help link: popup a window with help information
- Build groups: explained in the next section.
- Coverage: explained in the next section.
- Dynamic Analysis: explained in the next section.
Build groups
Each build submitted by a site corresponds to a row in the main dashboard. By default the build falls in the group defined by the type of submission (i.e Nightly, Experimental or Continuous), however, custom builds can be defined. See Build Groups administration section for more information on how to create new groups and define rules for builds.
- Mouse hover the top row of a build group, shows the quick link bar to quickly jump to a different group.
- Expected builds are shown as a empty row in the dashboard if they have not been submitting.
Default group
In this section we explain the layout of default groups (i.e. Nightly, Experimental, Continuous,...). These groups are represented in the light blue sections.
Clicking on the gray header allow sorting the table by the clicked field. Multisorting is possible by holding the shift key., also the current sorting is saved by the user's web browser using cookies, allowing to keep the same sorting while browsing different days for the same project.
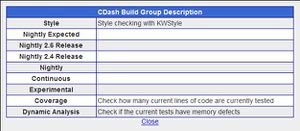
Clicking on the group name displays the build group description.
Each build (row) contains the following information:
- Site: Name of the site submitting the build. Clicking on the name redirects to site description.
- Build name: Name of the build. Clicking on the name redirects to the build summary page.
- Build note: If submitted with CTest and configure with build notes, a small icon shows the build note. Clicking on the icon displays the CTest script used to submit the page.
- CTest version: If submitted with CTest, a small icon displays the CTest version.
- Build info: If a build is expected and has not been submitting, or if a build has errors or warnings or tests failing, then a build info icon is present. Clicking on the build info icon trigger an ajax request that displays more information about this build.
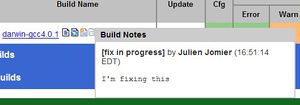
- Notes: If someone submitted a note for this build, mouse hover the note icon will display the current notes.
- Update: Shows the number of files updated (from the SVN/CVS repository) for this build. Clicking on the number shows the name and information of the updated files.
- Cfg: Shows the configuration errors. If red, some errors occurred while configuring the project. Clicking on the number displays the current configuration status.
- Build: Displays the principal build information.
- Error: Number of build errors.
- Warn: Number of build warnings.
- Min: Time (in minutes) it took to build the project.
- Test: Displays information about the test.
- Not Run: Number of test not run (because not found for instance).
- Fail: Number of test failed. Clicking on the number show the name of the failing tests. If time status is enabled for the project, it is reflected here.
- Pass: Number of test passed. Clicking on the number show the name of the passing tests. If time status is enabled for the project, it is reflected here.
- Min: Time it took to run all the tests.
- Build time: Time when the build started expressed in the timezone of the webserver. This is different from the time when the build was submitted.
Coverage
CDash supports gcov and bullseye as coverage tools. The main dashboard displays the following information:
- Site: name of the site
- Build name: name of the build
- Percentage: Overall coverage percentage (for all files in the project).
- Passed: Number of lines of code that are tested.
- Failed: Number of lines of code that are not tested.
- Date: Build starting date.
Dynamic Analysis
CDash supports valgrind as the main dynamic analysis tool. The main dashboard displays the following information:
- Site: Name of the site
- Build name: Name of the build
- Checker: Name of the checker.
- Defect count: Number of memory defects.
- Date: Build starting date.
Daily updates
CDash stores the daily updates in the database for a quick query. The number of files changed for that day as well as the number of authors who changed the files are displayed. Clicking on the number of files changed display the name of the files and more information.
See the Daily Updates Design section for more information.
Map
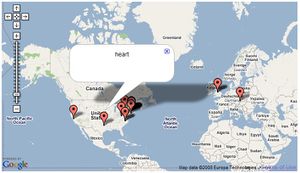
CDash stores the geolocation from the IP address for the sites and displays them on a map via Google map API. This allows to quickly browse where the builds are coming from. Clicking on a pin on the map, shows the name of the site.
See Map and Geolocation design page for more information.
My CDash
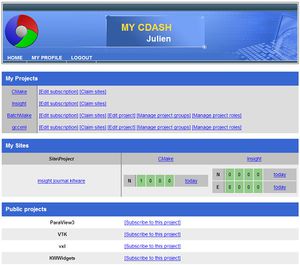
Each user has its own personal section in CDash, where they can keep track of recent builds, submissions, claim sites and more.
My Profile
User can change their profile: First/Last name, email, institution and password from the the "My Profile" menu at the top of the "My CDash" page.
My Projects
If a user has subscribe to at least a project (see Subscribe to project), the list of subscribed projects is shown under "My Projects". There several links related to the subscriptions.
Edit Subscription
Users can edit their subscription for a given project.
- From MyCdash page, under My Projects, click on [Edit subscription]
- Change the role if necessary. Downgrading from project administrator to Site maintainer or normal user cannot be reverted unless by another project administrator.
- Change or add CVS/SVN login
- Change the email preferences if necessary
- Click on "Update Subscription" to validate the modifications
Users can unsubscribe from a project by clicking on the "Unsubscribe" button. Users will be able to subscribe later on.
Claim sites
See Claim a site section.
Edit project
See Editing a project section.
Manage project groups
See Build groups section.
Manage project roles
See Project roles section.
My Sites
As a site maintainer, it is useful to know if submissions have been missing for quite sometime, or if the current builds on a specific sites are not reporting errors due to misconfiguration.
- The first column show the list of currently claimed sites.
- The first row shows the current projects that are submitting builds for the given site
- For each pair (site/project) a summary of the current status of the dashboard is displayed
| Build group | Updates | Errors | Warnings | Tests | Last submission |
|---|---|---|---|---|---|
| N: Nightly | 1 | 0 | 0 | 0 | Today |
| C: Continuous | 1 | 0 | 0 | 0 | Yesterday |
| E: Experimental | 1 | 0 | 0 | 0 | 6 days ago |
Note: only Nightly, Continuous and Experimental groups are current shown'.'
Clicking on the name of a site gives access to the description of the site.
Public projects
List of all the public projects stored in CDash. By definition, users registered in CDash can subscribe to any public projects.
Subscribe to project
If the project is public then users can subscribe to the project themselves, otherwise see section Project Roles.
- Log into CDash (see Login to CDash)
- Under "Public projects" section click on [Subscribe to this project]
- Select your role for the project: Normal user or Site maintainer if you are responsible for a machine sending periodic builds to the dashboard/
- Add your CVS/SVN login for the project if you have any
- Select your email preference
- Click on subscribe
Claim a site
CDash allows Site maintainers (see Subscribe to Project) to claim a site they are managing. This allows users to have personal reports regarding a specific machine and get informed if the machine has not been submitting from quite some time or has unexpected high number of failures (probably due to misconfiguration).
In order to claim a site:
- Login to CDash to acces "My CDash"
- Under "My Projects" select [Claim sites]. If the project is not listed, refers to Subscribe to Project for more information.
- The Claim sites page show the list of current sites for the project. Check the site(s) of interest.
- Click on "Update claimed sites"
In order to unclaim a site:
- Login to CDash to acces "My CDash"
- Under "My Projects" select [Claim sites].
- Uncheck the site(s) no longer of interest.
- Click on "Update claimed sites"
See the section Describe a site for information about the given sites.
Describe a site
CDash records each site specifications so that users can quickly assess the type of machine, OS, memory, etc...
If using the CTest 2.6 (or higher) the site specifications are automatically sent as part of the submission.
Here's the list of specification currently present:
- Name: This value shouldn't be changed, unless the site name sent by the build was wrong. Make sure the name of the build matches CTest buildname otherwise a new site will be created.
- 64 bits: Is the machine running a 64bits OS
- Processor vendor: vendor name of the processor (i.e. GenuineIntel)
- Processor vendor ID: vendor identification of the processor (i.e. Intel Corporation)
- Processor family ID: family identification number of the processor (i.e. 15)
- Processor model ID: model identification number of the processor, usually depending on the processor family (i.e. 3)
- Processor cache size: size of the processor cache in MB.
- CPU Speed (MHz): speed of the CPU in MHz.
- Number of logical CPUs: Number of logical CPU per physical CPU.
- Number of physical CPUs: Number of physical CPU.
- Logical Processor per Physical:Number of logical processor per physical
- Total virtual memory (MB): Total virtual memory in MB.
- Total physical memory (MB): Total physical memory (RAM) in MB.
- Description: Description of the machine.
- IP address: Current IP address. This is filled in automatically by CDash
- Latitude: Geolocation from the IP address
- Longitude: Geolocation from the IP address
CDash keeps an history of the machine description, in case of memory or processor upgrade. This is particularly useful to assess why a test is now running much faster than before. If the system has been upgraded, the checkbox "Force new description revision" should be checked. Note that CDash should automatically detect if a site has been upgraded.
Note: support for other specifications, such as graphic card information and more detailed information might be added in the near future.
Graphs
CDash relies on the flot javascript library for graphing. See the section Graphs for information. CDash curently plots three types of graph as explained below.
Build time graph
The time requires to build a project is recorded as part of CTest. Sometimes it might be useful to track the build time overtime. In order to do so:
- Go to the main dashboard for the project
- Click on the build name you want to track
- On the build summary page, click on [Show Build Time Graph], this performs an Ajax request to the database.
Test time graphs
CDash plots graphs of the time it takes to run a specific test as well as its status (passed/failed) overtime.
To look at these graphs:
- Go to the main dashboard for a project
- Click on the number of test passed or failed
- From the list of tests, click on the status of the test.
- Click on [Show Test Time Graph] and/or [Show Failing/Passing Graph]
Adding notes to a build
In some cases, it is useful to tell other developers that you are currently looking at the errors for a builds and informed them. CDash implements a simple note mechanism.
- Login to CDash
- On the dashboard project page, click on the build name to which you want to add the note.
- Click on [Add a Note to this Build] link, located next to the current build matrix (see thumbnail)
- Enter a small message corresponding to the note
- Select the status of the note: Simple note, Fix in progress, Fixed.
- Click on "Add Note"
Build summary
CDash summarizes the build errors and warnings on a single page. The errors are grouped by file and line number. It makes easier to fix source code. In order to see the build summary:
- Go to the main dashboard for the project
- In the main menu select Dashboard->Builds
Filters
Some CDash pages allow you to use filters to narrow down the results to what's important to you.
Filters on index.php
| Name | Description | Example Value |
|---|---|---|
| Build Duration | How long the build took to complete | 14m 58s |
| Build Errors | How many errors occurred during the build step | 1 |
| Build Warnings | How many warnings occurred during the build step | 5 |
| Build Name | The name of the build | Linux-cxx |
| Build Stamp | The CTest-generated TAG for this build | 20090223-0100-Nightly |
| Build Start Time | When this build started (including any update/configure/etc) | 2009-02-23 01:00:00 UTC |
| Build Type | What type of build this is | Experimental |
| Configure Duration | How long this build took to configure | 2m 45s |
| Configure Errors | How many errors occurred during the configure step | 2 |
| Configure Warnings | How many warnings occurred during the configure step | 3 |
| Expected | Whether or not this build has been marked as expected | true |
| Group | The name of this build's group | Nightly |
| Has Coverage | Whether or not this build performed coverage | true |
| Has CTest Notes | Whether or not any notes were uploaded with this build | false |
| Has Dynamic Analysis | Whether or not this build performed dynamic analysis | true |
| Has User Notes | Whether or not a CDash user left a note on this build | true |
| Label | Search for builds with a given label | vtkCommonCore |
| Revision | The version of the source code that was built (git SHA1, SVN version, etc) | e19dbfa |
| Site | Search for builds from a given site | kamino |
| Submission Client | What client was used to submit this build | ctest-3.0 |
| SubProjects | Whitelist or blacklist SubProject results | my-subproject-name |
| Tests Duration | How long this build took to test | 5m 23s |
| Tests Failed | How many tests failed | 4 |
| Tests Not Run | How many tests couldn't be run | 10 |
| Tests Passed | How many tests passed | 20 |
| Tests Timing Failed | How many tests failed the time status check | 8 |
| Update Duration | How long this build took to update | 45s |
| Updated Files | How many source files were updated before this build | 5 |
Filters on queryTests.php
| Name | Description | Example Value |
|---|---|---|
| Build Name | The name of the build that performed this test | Linux-c++ |
| Build Start Time | When this build started (including any update/configure/etc) | 2009-02-23 01:00:00 UTC |
| Details | Information about how this test exited | OTHER_FAULT |
| Label | Search for tests with a given label | vtkCommonCore |
| Site | Search for tests run on a given site | kamino |
| Status | Search for tests with a given status | passed |
| Test Name | The name of the test | kwsys.testHashSTL |
| Time | How long this test took to run (in seconds) | 12.73 |
Filters on testOverview.php
| Name | Description | Example Value |
|---|---|---|
| Build Name | The name of the build(s) whose tests you're interested in | Linux-c++ |
Filters on viewCoverage.php
| Name | Description | Example Value |
|---|---|---|
| Covered Lines | The number of covered lines in this file | 50 |
| Filename | The name of this file | foo.cxx |
| Priority | The priority of this source file | 2 |
| Total Lines | The number of coverable lines in this file | 100 |
| Uncovered Lines | The number of uncovered lines in this file | 25 |
Filters on viewTest.php
| Name | Description | Example Value |
|---|---|---|
| Details | Information about how this test exited | OTHER_FAULT |
| Label | Search for tests with a given label | vtkCommonCore |
| Status | Search for tests with a given status | passed |
| Test Name | The name of the test | kwsys.testHashSTL |
| Time | How long this test took to run (in seconds) | 12.73 |
| Time Status | Whether or not this build failed the time status check | 1 |
