Python Calculator: Difference between revisions
No edit summary |
|||
| Line 3: | Line 3: | ||
== Supported Function List == | == Supported Function List == | ||
Below is a list of mathematical functions currently supported by this python calculator. Notice that these functions are also available in the python programmable filter. | Below is a list of mathematical functions currently supported by this python calculator. Notice that these functions are also available in the python programmable filter. | ||
<table border="1"> | <table border="1"> | ||
| Line 17: | Line 16: | ||
<td>abs</td> | <td>abs</td> | ||
<td>scalar vector tensor</td> | <td>scalar vector tensor</td> | ||
<td>1</td> | <td align="center">1</td> | ||
<td>point or cell</td> | <td>point or cell</td> | ||
</tr> | </tr> | ||
| Line 238: | Line 237: | ||
</table> | </table> | ||
== Comments == | == Comments == | ||
Revision as of 00:03, 6 August 2010
The python calculator is a programmable calculator that provides common mathematical operations and apply them on the point data, cell data or the input datasets directly. It is similar to the python programmable filter and utilizes its functionality to build python scripts for execution. For efficiency, the actual computation is delegated either to corresponding VTK filters or to the numpy library.
Supported Function List
Below is a list of mathematical functions currently supported by this python calculator. Notice that these functions are also available in the python programmable filter.
| Name | Supported Operand Types | Number of Operands | Data Association |
|---|---|---|---|
| abs | scalar vector tensor | 1 | point or cell |
| cross | vector | 2 | point or cell |
| curl | vector | 1 | point or cell |
| det | tensor | 1 | point or cell |
| determinant | tensor | 1 | point or cell |
| dot | scalar vector | 2 | point or cell |
| eigenvalue | tensor | 1 | point or cell |
| eigenvector | tensor | 1 | point or cell |
| global_mean | scalar vector tensor | 1 | point or cell |
| global_max | scalar vector tensor | 1 | point or cell |
| global_min | scalar vector tensor | 1 | point or cell |
| gradient | scalar vector | 1 | point or cell |
| inverse | tensor | 1 | point or cell |
| laplacian | scalar | 1 | point or cell |
| ln | scalar vector tensor | 1 | point or cell |
| log(==ln) | scalar vector tensor | 1 | point or cell |
| log10 | scalar vector tensor | 1 | point or cell |
| max | scalar vector tensor | 1 | point or cell |
| min | scalar vector tensor | 1 | point or cell |
| mean | scalar vector tensor | 1 | point or cell |
| mag | scalar vector | 1 | point or cell |
| norm | scalar vector | 1 | point or cell |
| strain | vector | 1 | point or cell |
| trace | tensor | 1 | point or cell |
| vorticity | vector | 1 | point or cell |
| Name | Supported Cell Types | Data Association |
|---|---|---|
| area | trig quad | cell |
| aspect | trig quad tet | cell |
| aspect_gamma | tet | cell |
| diagonal | hex | cell |
| jacobian | quad tet hex | cell |
| max_angle | trig quad | cell |
| min_angle | trig quad | cell |
| shear | quad hex | cell |
| skew | quad hex | cell |
| surface_normal | trig | cell |
| volume | tet hex | cell |
| vertex_normal | trig | point |
Comments
The first list gives all the math functions that work with point data or cell data. The general calling signature is function_name(array) for functions taking one operand or function_name(array1, array2) for functions taking two operands. For example, abs(Normals) computes the absolute value for all normals associated with the dataset component-wise. The array association must be given throuth the GUI interface of the python calculator.
The second list gives all the math functions that directly work with a dataset. Most of them work on the cells of a dataset, with only one exception vertex_normal which computes the normal for each point in a dataset. The calling signature of this category is function_name(inputs[0]) where inputs[0] is defined within the calling context by paraview to be your first input dataset.
In the lists, vector means 3D vectors and tensor stands for 3 by 3 matrix. trig is triangle, quad is quadrilateral, tet is tetrahedron and hex is hexahedron.
Examples
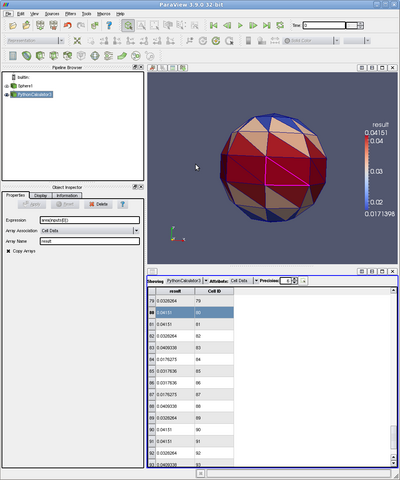
Compute area for each cell
area(inputs[0]) and array association set to Cell Data

Compute vector length for each point
sqrt(dot(BrownianVectors,BrownianVectors)) or equivalently mag(BrownianVectors)
where BrownianVectors is an array of 3D vectors that are associated with each point in the dataset. Array association set to Point Data.
A more complex example
max(abs(trace(inverse(gradient(Normals)))))
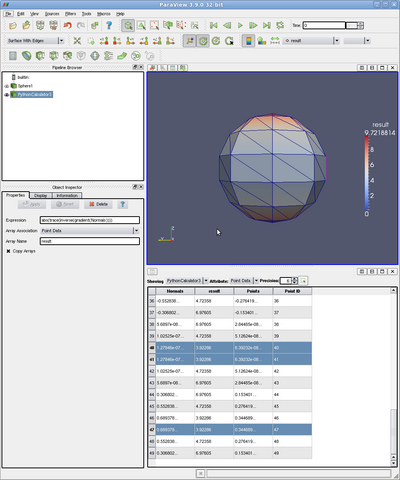

Normals is an array of 3D vectors that are associated to each point in the dataset. The expression first computes for each component of the normal vector its gradient, therefore effectively generates a tensor and then it takes the inverse of the generated matrix and then sum everything on the diagonal of the inverse matrix and then computes the absolute value of the sum and then looks for the maximum of all the absolute values.