ParaView/Custom Filters: Difference between revisions
No edit summary |
|||
| Line 18: | Line 18: | ||
</graphviz> | </graphviz> | ||
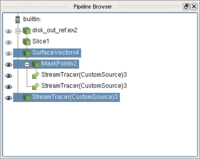
[[Image:CustomFilterPipelineBrowser.png|200px|thumb|'''Figure 1''': Pipeline for generating surface streamlines]] | |||
In this example we'll create a new filter to create surface streamlines. As a first step, we set up the pipeline in ParaView. '''Figure 1''' shows the pipeline brower for the pipeline. Here, the vector field source is "Slice1". | In this example we'll create a new filter to create surface streamlines. As a first step, we set up the pipeline in ParaView. '''Figure 1''' shows the pipeline brower for the pipeline. Here, the vector field source is "Slice1". | ||
{{ParaView/Template/Footer}} | {{ParaView/Template/Footer}} | ||
Revision as of 19:22, 12 September 2008
ParaView is a pipeline-based framework: user loads in data and then applies a bunch of filters forming a pipeline to further process and then possibly render or save the result. Often times users find themselves applying the same set of filters with some minor parameter tweaks for a few filters in the pipeline to different datasets. With what we call custom filters, it's possible for the user to combine the pipeline into a single filter while exposing a set a properties from the internal filters that need tweaking. Additionally, the user can then share his custom filter's with other users.
This document describes how to create and use custom filters.
Surface Streamlines
One very commonly asked question on the mailing list is how to create surface streamlines. The pipeline for that looks like this:
Error writing graphviz file to disk.
In this example we'll create a new filter to create surface streamlines. As a first step, we set up the pipeline in ParaView. Figure 1 shows the pipeline brower for the pipeline. Here, the vector field source is "Slice1".
