ParaView/Users Guide/Plotting and Probing Data
There are multiple ways of probing a data set for point or cell values. The simplest is the Probe Location filter. Additionally, there are a variety of filters to plot data with respect to time, location, or grid object Id.
Probe Filter
The probe filter can be used to query a data set for point or cell data.
Options for the probe filter are:
- Show point button is used to show where the center of the sphere is for generating the probe points.
- Center on bounds will place the sphere center at the center of the data set's bounds.
- The sphere center can either be set in the properties tab of the object inspector or in the 3d view with the mouse cursor. To choose a new point in the 3d view window, press P and then click on the desired point. Note that the Show Point option must be selected in order to activate the point widget.
The output for this filter is a single cell comprised of a set of points in a vtkPolyData.
Line Plots
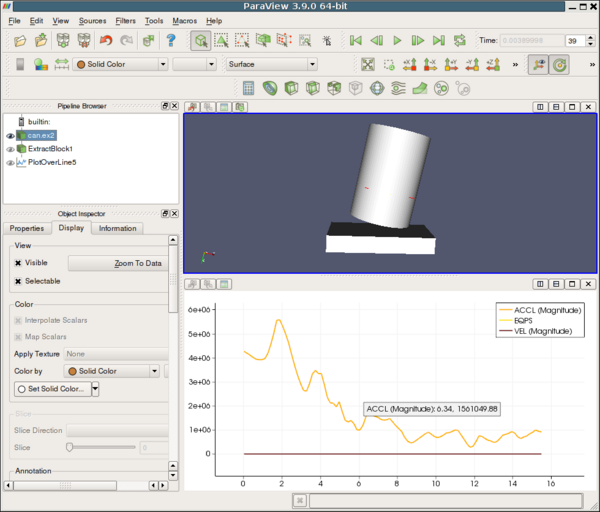
The line plots have similar control functionality for displaying the results. These options are in the Display tab of the Object Inspector and include selecting which point and/or cell data to include in the plot, what should be used as the x axis values (e.g. point/cell index or a specified point or cell data array), and plot preferences such as line thickness and marker style. See the line chart view section for more information on setting the display properties for these filters. An example line plot is shown below.
Plot Data / Scatter Plot
The Plot Data filter and Scatter Plot filter are very similar in functionality with the Scatter Plot filter being a deprecated version of the Plot Data filter. The main difference is that the Scatter Plot filter's output is a 1D rectilinear grid while the Plot Data filter's output is the same type as the input.
The Plot Data filter plots point or cell data over the entire data set. By default the x axis values are determined with respect to their point or cell index.
Plot Over Line
The Plot Over Line filter is used to plot point data over a specified straight line. The Plot Over Line filter will not display cell data over the line so the user can use the Cell Data to Point Data filter to convert cell data to point data in order to use this filter for viewing desired cell data. The line geometry can specified either by setting the points in the Properties tab of the Object Inspector or by pressing P and selecting the beginning and ending points of the line. Note that the Show Line option must be selected to activate the line widget. The resolution option is used to specify at how many evenly spaced points on the line to query the data set for information the point data to plot with respect to.
Plot on Sorted Lines
The Plot on Sorted Lines filter is used when polydata with line cell types have been extracted from a data set and the user wants to see how point data varies over the line. This filter orders the lines by their connectivity instead of their point index. The output of the filter is a multiblock with a block for each contiguous line.
Plot on Intersection Curves
The Plot on Intersection Curves filter is used to plot point data where the data set intersects the given polygonal slice object. The results is a multiblock of polydatas where each block represents a contiguous set of cells. Note that the polydatas will only have 1D cell types. Thus if the slice type object intersection with the data set has 2D geometry the filter will take the boundary of the slice type object in order to reduce down to 1D geometry. If the slice type is a sphere which is wholly contained in a volumetric data set then the filter parameters are invalid and no lines will be output.
Plot Selection Over Time
The Plot Selection Over Time filter can be used to visualize the variation of point or cell data from a selection with respect to time. The selection should be made on the data set of the filter that precedes the Plot Selection Over Time filter in the pipeline in order to ensure that the proper points or cells are selected. Note that information for only a single point or cell can be plotted at a time.
Plot Global Variables Over Time
The Plot Global Variables Over Time filter plots field data that is defined over time. Filters must be set up explicitly to provide the proper information as this will not work for field data in general. As an example see the Exodus reader in ParaView.
