Advanced Tips and Tricks
From KitwarePublic
Jump to navigationJump to search
Introduction
This wiki page holds tips and tricks that don't fit anywhere else, or are small enough that they don't deserve their own tutorial.
Creating a Custom Filter
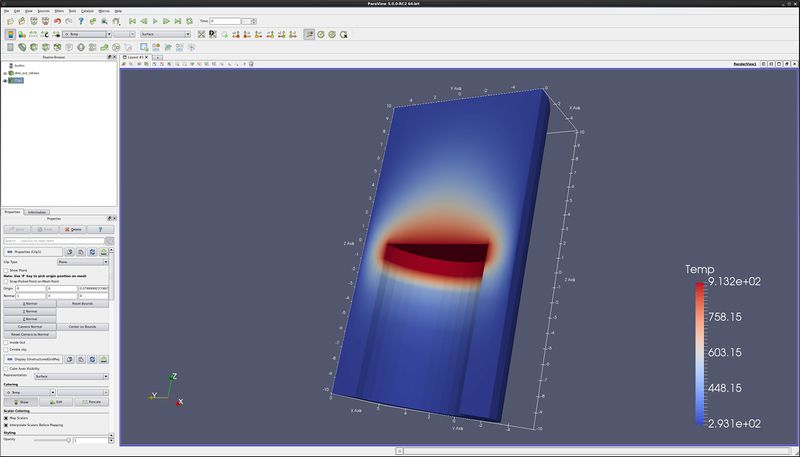
- Open data set disk_out_ref.exo. This dataset can be downloaded at http://www.paraview.org. On the Properties tab, select all variables and press the Apply button. On the Display tab, select Color by Temp.
- Clip filter. Clip type – Scalar. Apply. (The Scalars and Values don’t matter right now)
- From the Tools menu, select Create Custom Filter.
- Name this filter ClipByScalar (IsoVolume). Next.
- Take the default inputs. Next.
- Take the default outputs. Next.
- Select the clip (in the left window), and pull down the pull down menu for Property. Select Scalars. Hit the blue plus sign. Do the same for Value and Inside Out.
- Finish.
- Now, delete the clip filter in the pipeline browser.
- Open Filters/ Alphabetical/ ClipByScalar. Turn Scalars to Temp, enter a Value of 400, and hit Apply. We now have a ClipByScalar filter (sometimes incorrectly know as an IsoVolume filter).
Cube Axes
- Open dataset disk_out_ref.exo.
- On the Display tab, scroll down to the Annotation section, and select Show Cube Axes.
- Note that you can edit the Cube Axes attributes.
Temporal Statistics Filter
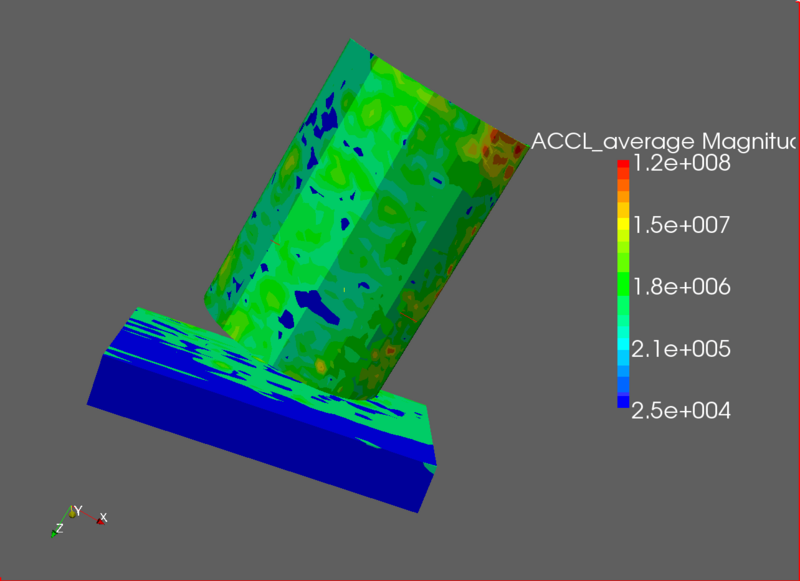
- Open dataset can.exo. Read in all variables. Apply.
- Filters → Temporal → Temporal Statistics. Apply.
- Color by ACCL_average. Color by ACCL_maximum. Color by DISPL_average. You can now visually see average acceleration, maximum acceleration and average displacement of each cell.
- To see the ranges of these variables over the whole mesh, look in the Information tab.
Creating vectors from 2 or 3 scalars
- Open dataset can.exo. Read in all variables. Apply.
- Filters → Common → Calculator
- Build the vector equation using the iHat, jHat and kHat buttons on the calculator. For instance, this example will create a vector representing the acceleration in the X and Y plane.
- Result Array Name → “ACCL-XY”
- Equation is “ACCL_X*iHat+ACCL_Y*jHat”
- Be sure to color by variable ACCL-XY.
Mesh quality
- Mesh quality is created using the Mesh Quality filter.
- Open dataset can.exo. Read in all variables. Apply.
- Filters → Alphabetical → Mesh Quality. Take the defaults. Apply.
- Next, we want to only look at those cells that are below some threshold of quality. Filters → Common → Threshold.
- Choose Scalars of “Quality”, and Lower Threshold of 4 and Upper Threshold of 1000.
- Turn visibility of can.ex2 on, and Representation of Wireframe.
- Animate (Play).
Error creating thumbnail: Unable to save thumbnail to destination
Mark cells as errors that are outside of a range
- At present, it is impossible to “flag” cells that are outside of a range with a “bad variable” color. It is possible to closely approximate this effect with a trick. A permanent solution will be in a future version of ParaView.
- Open dataset disk_out_ref.exo. Read in all variables. Apply.
- Color by PedigreeElementId
- Open the Display tab → Edit Color Map dialog box.
- Click on the color scale line, as close as possible to the left end of the line. Do the same to the right end of the line.
- Select the left end “button” of the color scale line. Select your preferred minimum error color – for instance, black.
- Select the right end “button” of the color scale line. Select your preferred maximum error color – for instance, white.
- Unselect the Automatically Rescale to Fit Data Range button.
- Click Rescale Range, and enter your desired Minimum and Maximum. Rescale.
- If you desire, try to move the left and right points that you created above as close as possible to the color scale line end points. Close.
- Note that there will be a small range, between the points close to the ends of the color scale line and at the end of the color scale line that will grade from your error color to the acceptable color.
Error creating thumbnail: Unable to save thumbnail to destination
Backface style
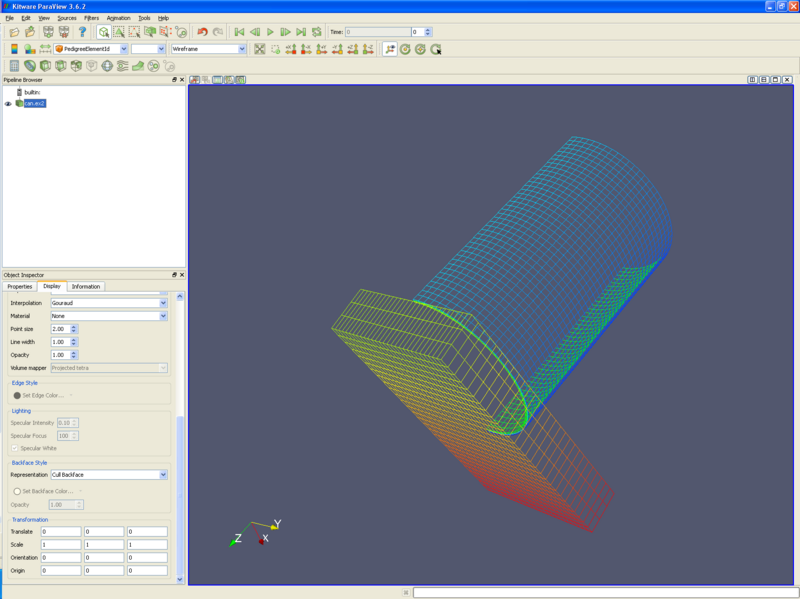
- It is possible to change the backface style of a wire frame object.
- Open dataset can.exo. Apply.
- Color by PedigreeElementId.
- Representation Wireframe.
- Open the Display tab. Slide down a few pages until you find Backface Style.
- Change Backface Style - Representation to Cull Backface.
Creating normal vectors from a 2d plane
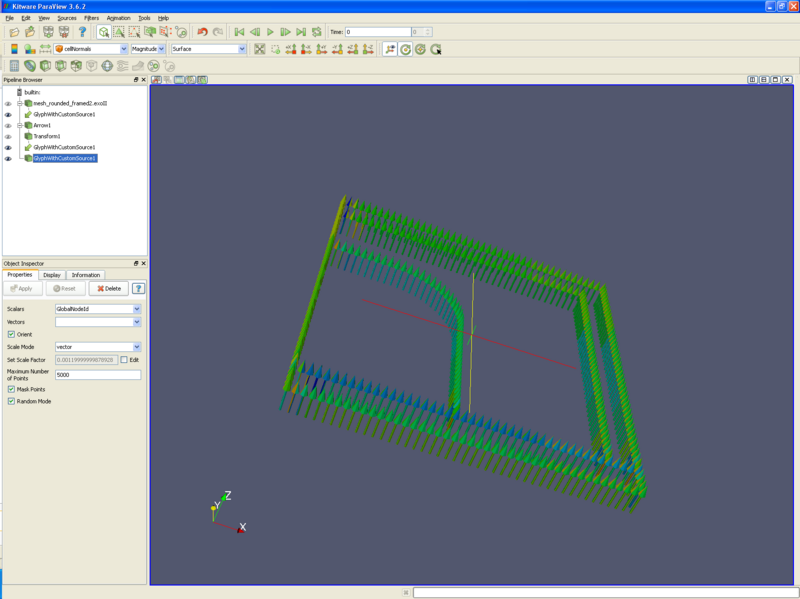
- It is possible to create glyph arrows normal to a 2d plane, including sideset data on this 2d plane. You need to define the direction of the desired normals, and then use the custom glyph filter.
- First, create a vector in the direction that is desired.
- One solution is to use sources/arrow. In ParaView, choose Sources/ Arrow. Apply. Next, use the Filters/ Alphabetical/ Transform filter to orient this arrow down the axis desired.
- Another solution would be to create this vector using the calculator.
- Next, select Filters/ Alphabetical/ Glyphs With Custom Source.
- Input should point at your data. (Select Input, then in the left dialog window click on your data)
- Source should point at the transform filter. (Select Source, then in the left dialog window click on the transform filter)
- OK
- Apply.
- Turn off visibility of the Transform filter, and also your source data.
- If necessary, hit the reset button.
Acknowledgements
Sandia is a multiprogram laboratory operated by Sandia Corporation, a Lockheed Martin Company, for the United States Department of Energy’s National Nuclear Security Administration under contract DE-AC04-94AL85000.


