Beginning Filters Python
Introduction
ParaView filters
This usecase shows a user how to use filters to modify the display of data.
All filter examples assume that the user starts with a new model. To start over, go to the menu item Edit → Delete All, and then re-open your data.
Data is opened by going to File → Open. Example data files can be found on the ParaView web page at http://www.paraview.org.
Clip filter
<source lang="python"> >>> from paraview.simple import * >>> reader = ExodusIIReader(FileName=".../can.ex2") >>> Show(reader) >>> Render() </source>
<source lang="python"> >>> clipFilter = Clip(reader) >>> Hide(reader) >>> Show(clipFilter) >>> Render() </source>
<source lang="python">
- get camera
>>> camera = GetActiveCamera() >>> camera.GetPosition()
- figure out where you are
>>> camera.SetPosition(4.156,4.0,-36.29) >>> camera.Elevation(30) >>> camera.GetPosition() (4.1560389876787056, 19.261366923548998, -32.200729057625857) >>> camera.SetPosition(4.15603, 30, -35) >>> Render() </source>
<source lang="python">
- we can see what's going on a little better
>>> clipFilter.UseValueAsOffset = 1 >>> clipFilter.Value = 5 >>> Render() </source>
<source lang="python">
- let's change the orientation of the clip filter
>>> clipFilter.ClipType.Normal [1.0, 0.0, 0.0] >>> clipFilter.ClipType.Origin [0.0, 0.0, 0.0]
- reset the offset value of the clip to 0
>>> clipFilter.Value = 0 >>> clipFilter.ClipType.Normal = [0,0,1] >>> Render() </source>
<source lang="python"> >>> clipFilter.Value = -3 >>> Render() </source>
<source lang="python"> >>> clipFilter.InsideOut = 1 >>> Render() </source>
Slice filter
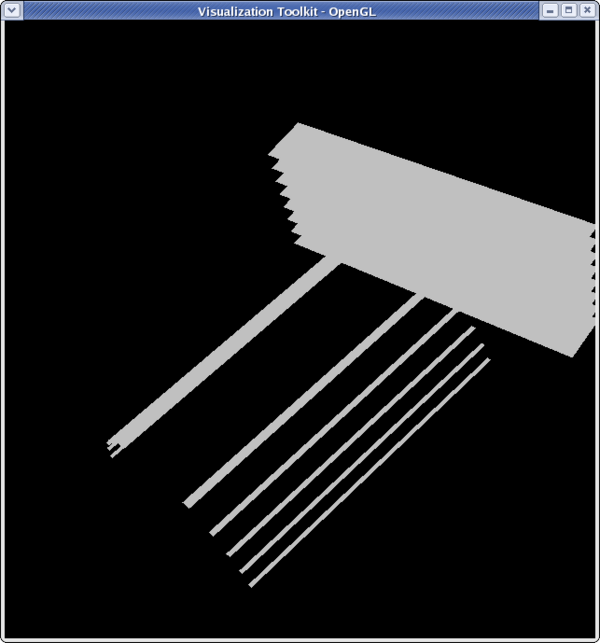
Getting the camera on this one can be right since the slices are invisible from certain angles.
<source lang="python">
>>> from paraview.simple import *
>>> reader = ExodusIIReader(FileName=".../Data/can.ex2")
>>> sliceFilter = Slice(reader)
>>> Show(sliceFilter)
>>> Render()
>>> camera = GetActiveCamera()
>>> camera.Elevation(30)
>>> camera.SetPosition(-51.3152,4.987,-9.64218)
>>> Render()
</source>
 <source lang="python">
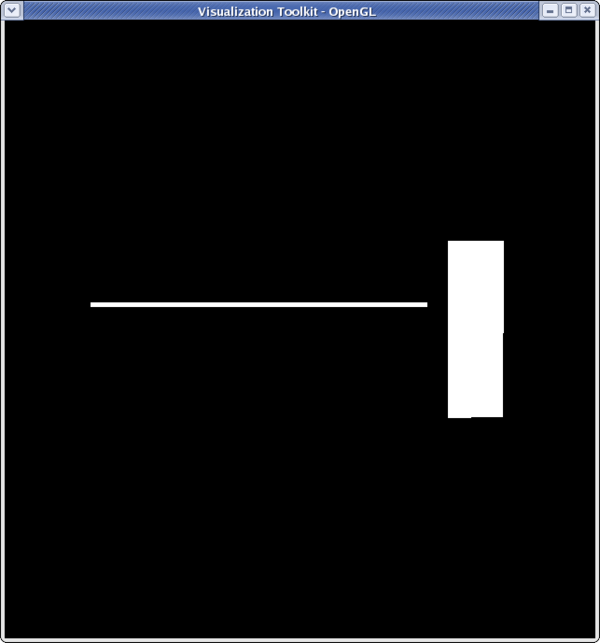
>>> sliceFilter.SliceType.Normal
[1.0, 0.0, 0.0]
- the origin of the slice needs to be moved to see slices in the Y-plane
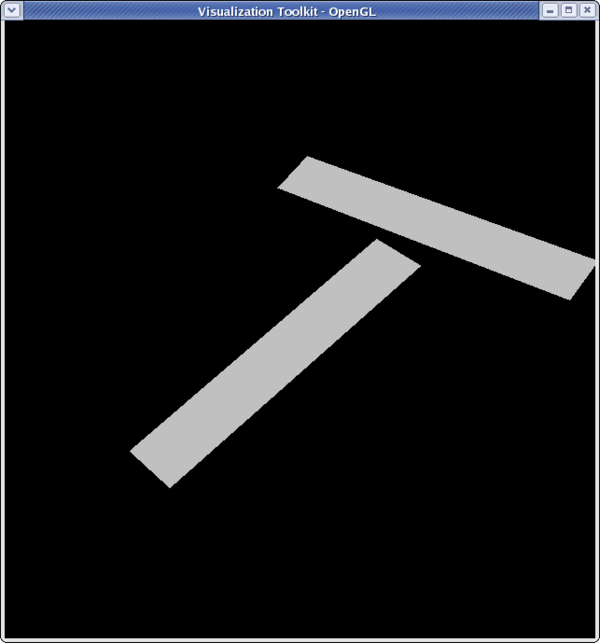
>>> sliceFilter.SliceType.Origin = [2.5,5,0]
>>> sliceFilter.SliceType.Normal = [0,1,0]
>>> Render()
</source>
 <source lang="python">
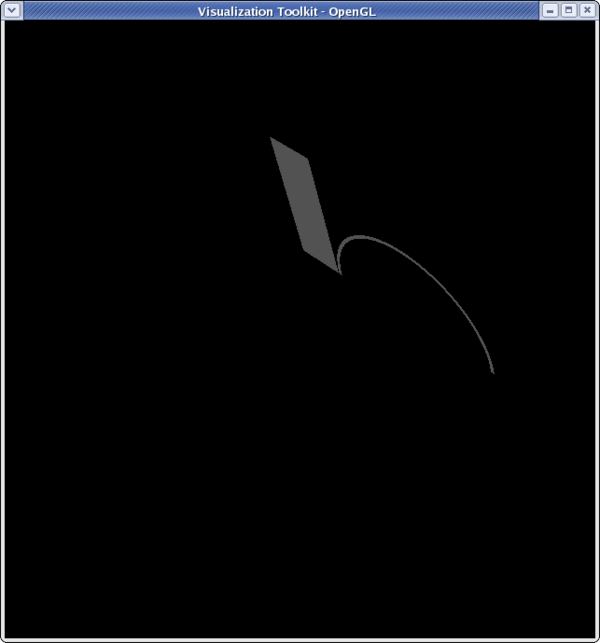
>>> sliceFilter.SliceType.Normal = [0,0,1]
>>> Render()
</source>
 <source lang="python">
>>> sliceFilter.SliceType.Normal = [0,1,0] >>> sliceFilter.SliceOffsetValues [] >>> sliceFilter.SliceOffsetValues = [-4,-3.11,-2.22,-1.33,-0.44,0.44,1.33,2.22,3.11,4] >>> Render()
Glyph filter
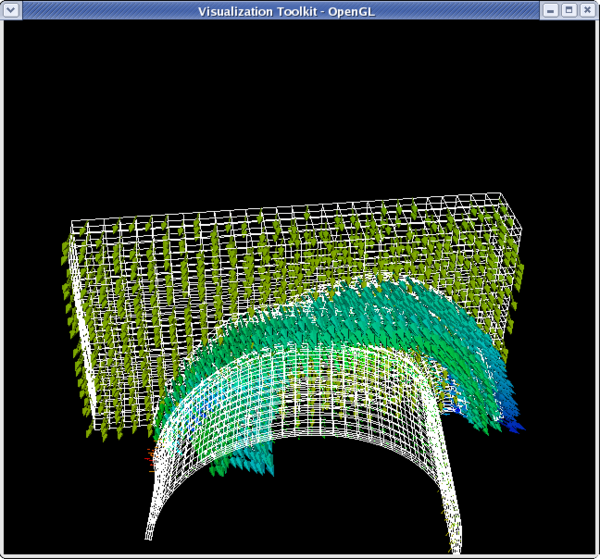
<source lang="python"> >>> from paraview.simple import * >>> reader = ExodusIIReader(FileName=".../Data/can.ex2") >>> Show(reader) >>> camera = GetActiveCamera() >>> camera.SetPosition(0,5,-45) >>> camera.Elevation(30)
- Change the can to be wireframe so we can see the glyphs
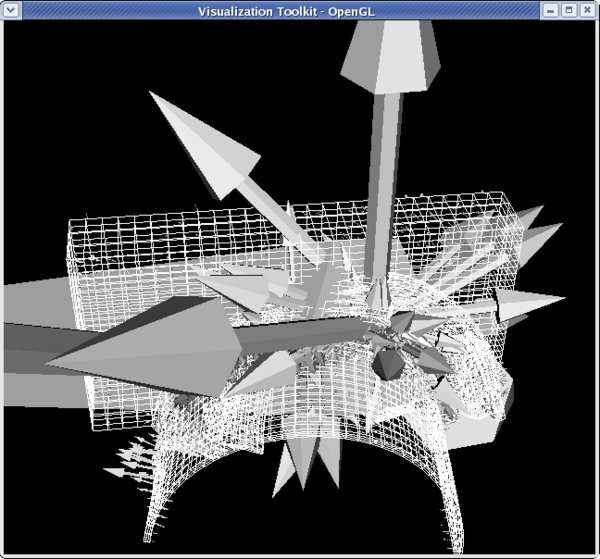
>>> dp1 = GetDisplayProperties(reader) >>> dp1.Representation = 'Wireframe'
>>> glyphFilter = Glyph(reader)
- We won't see much if we don't move forward in the animation a little bit
>>> tsteps = reader.TimestepValues >>> view = GetActiveView() >>> view.ViewTime = tsteps[20]
>>> glyphFilter.Vectors ['POINTS', 'DISPL']
- Set the glyphs to use the acceleration vectors and adjust scale factor
>>> glyphFilter.Vectors = 'ACCL'
>>> glyphFilter.SetScaleFactor
1.0
>>> glyphFilter.SetScaleFactor = 0.0000002
</source>
 <source lang="python">
- Set the glyphs to use the velocity vectors and adjust scale factor
>>> glyphFilter.Vectors = 'VEL' >>> glyphFilter.SetScaleFactor = 3e-4
- Let's add some color
>>> dp2 = GetDisplayProperties(glyphFilter) >>> glyphFilter.PointData[:] [Array: PedigreeNodeId, Array: DISPL, Array: VEL, Array: ACCL, Array: GlobalNodeId, Array: GlyphVector]
- We'll color by velocity so use that array.
>>> vel = glyphFilter.PointData[2] >>> vel.GetName() 'VEL' >>> vel.GetRange() (-2479.9521484375, 1312.5040283203125) >>> dp2.LookupTable = MakeBlueToRedLT(-2479.9521,1312.5) >>> dp2.ColorAttributeType = 'POINT_DATA' >>> dp2.ColorArrayName = 'VEL' >>> Render()
Threshold filter
<source lang="python">
>>> from paraview.simple import *
>>> reader = ExodusIIReader(FileName=".../Data/disk_out_ref.ex2")
>>> Show(reader)
>>> dp1 = GetDisplayProperties(reader)
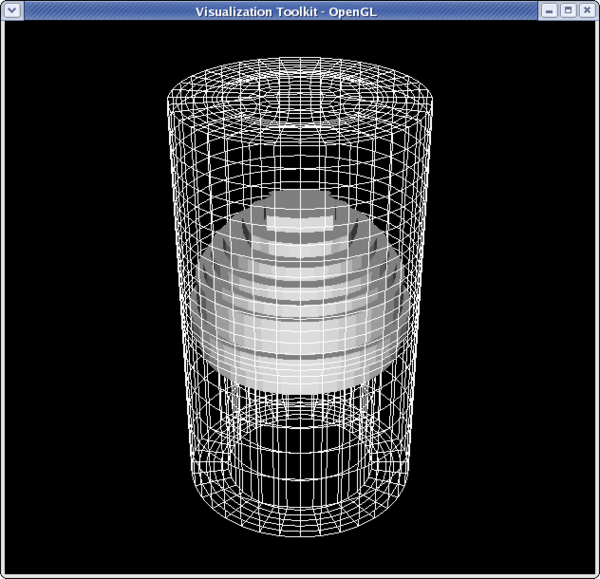
>>> dp1.Representation = 'Wireframe'
>>> camera = GetActiveCamera()
>>> camera.Elevation(-60)
>>> thresholdFilter = Threshold(reader)
>>> thresholdFilter.Scalars
['POINTS', 'GlobalNodeId']
>>> thresholdFilter.Scalars = 'Temp'
>>> Show(thresholdFilter)
>>> thresholdFilter.ThresholdRange
[0.0, 0.0]
>>> thresholdFilter.ThresholdRange = [398.55,913.15]
>>> Render()
</source>
 <source lang="python">
>>> dp2 = GetDisplayProperties(thresholdFilter)
>>> thresholdFilter.PointData[:]
[Array: GlobalNodeId, Array: PedigreeNodeId, Array: Temp, Array: V, Array: Pres, Array: AsH3, Array: GaMe3, Array: CH4, Array: H2]
>>> temp = thresholdFilter.PointData[2]
>>> temp.GetRange()
(400.46258544921875, 846.694091796875)
>>> dp2.LookupTable = MakeBlueToRedLT(400.4625,846.6909)
>>> dp2.ColorAttributeType = 'POINT_DATA'
>>> dp2.ColorArrayName = 'Temp'
>>> Render()
</source>
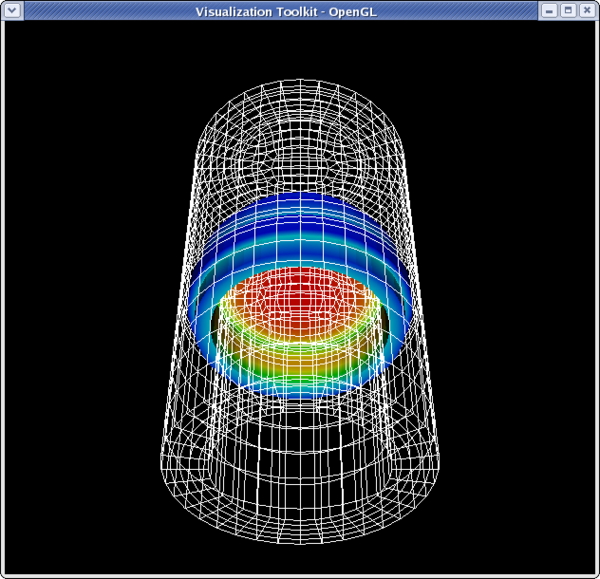 <source lang="python">
- set the lower threshold to 500
>>> thresholdFilter.ThresholdRange[0] = 500
>>> Render()
</source>
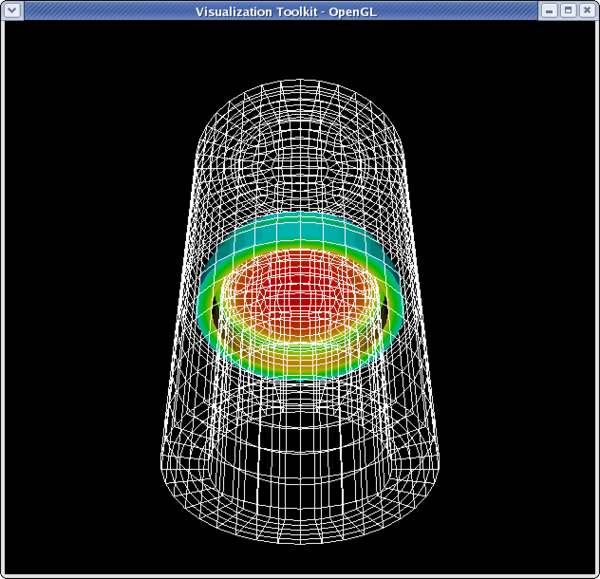 <source lang="python">
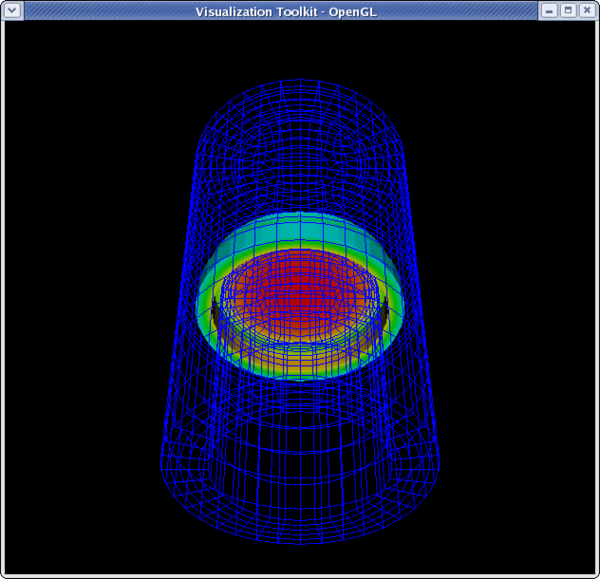
>>> dp1.LookupTable = MakeBlueToRedLT(400.462,84609)
>>> dp1.ColorAttributeType = 'POINT_DATA'
>>> dp1.ColorArrayname = 'Temp'
>>> Render()
</source>
Contour filter
Clip to Scalar filter
<source lang="python"> >>> from paraview.simple import * >>> reader = ExodusIIReader(FileName=".../Data/disk_out_ref.ex2") >>> clipFilter = Clip(reader) >>> clipFilter.ClipType = 'Scalar'
>>> clipFilter.Scalars = 'Temp' >>> clipFilter.Value = 400 >>> Show(clipFilter) >>> camera = GetActiveCamera() >>> camera.Elevation(-90) >>> Render()
</source>
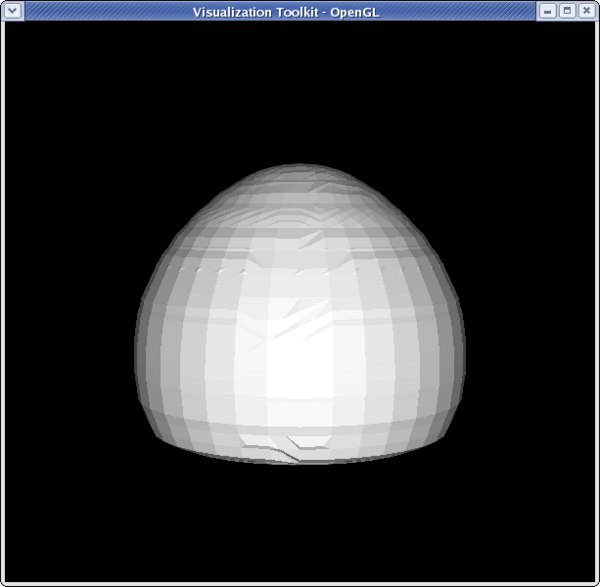 <source lang="python">
>>> clipFilter2 = Clip(clipFilter) >>> Show(clipFilter2) >>> Hide(clipFilter)
>>> camera.SetPosition(-39,0,1.46) >>> camera.Roll(90)
</source>
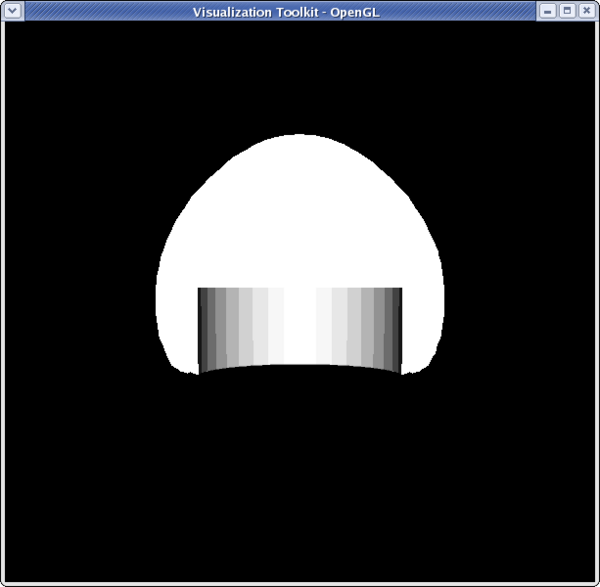 <source lang="python">
>>> dp1 = GetDisplayProperties(reader) >>> dp2 = GetDisplayProperties(clipFilter2) >>> clipFilter2.PointData[:] [Array: Temp, Array: V, Array: Pres, Array: AsH3, Array: GaMe3, Array: CH4, Array: H2] >>> temp = clipFilter2.PointData[0] >>> temp.GetRange() (399.99999999999994, 913.1500244140625) >>> dp2.LookupTable = MakeBlueToRedLT(400,913.15) >>> dp2.ColorAttributeType = 'POINT_DATA' >>> dp2.ColorArrayName = 'Temp' >>> Hide(reader) >>> Render()
</source>
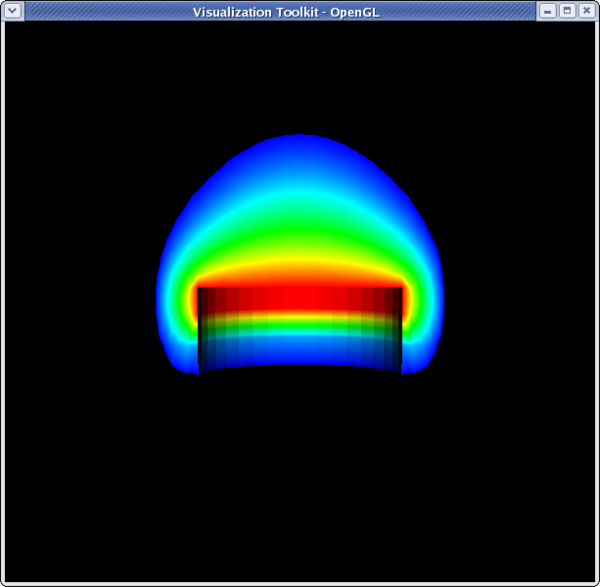 <source lang="python">
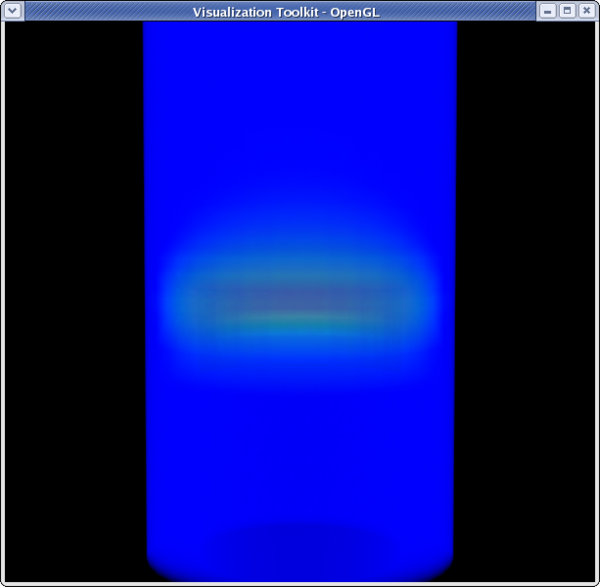
>>> dp1.Representation = 'Volume' >>> temp.GetRange() (399.99999999999994, 913.1500244140625) >>> dp1.LookupTable = dp2.LookupTable >>> dp1.ColorAttributeType = 'POINT_DATA' >>> dp1.ColorArrayName = 'Temp' >>> Render()
Cell to Point/ Point to Cell filters
These filters are used to convert a data set from being cell data to being point data and vice versa. This is sometimes useful if a filter requires one type of data, and a user only has the other type of data. An example would be using can.exo. You cannot get a contour of EQPS directly, since EQPS is cell data and contour only works on points. Use filter Cell Data to Point Data first, then call contour.
Stream Tracer
Calculator filter
Acknowledgements
Sandia is a multiprogram laboratory operated by Sandia Corporation, a Lockheed Martin Company, for the United States Department of Energy’s National Nuclear Security Administration under contract DE-AC04-94AL85000.
