ParaViewWeb PWApp: Difference between revisions
| Line 40: | Line 40: | ||
==Process your data== | ==Process your data== | ||
The PWApp interface is divided in 3 sections. | |||
* Header (Top) | |||
** Logo + Title | |||
** Progress bar when needed | |||
** Quit button | |||
* Control panel (Left) | |||
** Embed all the control on the processing filters and their representations. | |||
** Embed the data informations | |||
* View (Center) | |||
** Embed a toolbar | |||
** 3D render view. | |||
In the control panel the user can switch ON any filter by choosing any available representation (Outline, Wireframe, Surface, Surface with edges) or switching OFF by choosing to hide a given filter (Red cross in the Stack header). | |||
If the panel of a given filter is not collapse, the user can ... | |||
* choose which color mapping should be used. | |||
* Show or hide the selected color mapping scalar bar | |||
* Show of hide the 3D interactive widget when available | |||
* Change some filters parameters | |||
In the view toolbar, the user can reset the camera position to see the whole object and recenter the rotation center as well as showing/hiding rotation center and orientation axis. | |||
Moreover, the rendering image can be saved as well as saving the paraview state. | |||
[[File:ParaViewWeb-widgetSmall.png|600px]] | [[File:ParaViewWeb-widgetSmall.png|600px]] | ||
Revision as of 21:43, 24 June 2010
Introduction
The PWApp application has been designed to illustrate how ParaView can be used as a backend for relatively complex 3D data processing on the Web. The Google GWT JavaScript toolkit has been used to build this application. The purpose of that application is to illustrate what can be done on the Web in term of interactivity with data processing involved. It has not been built to replace ParaView, but it should only be seen as a glimpse of what can be done with the ParaViewWeb framework.
First step
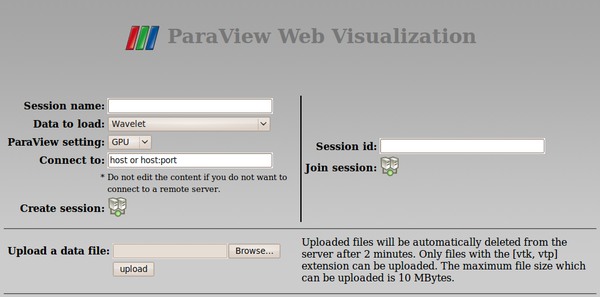
When you first connect to the PWApp, you can either
- Create a new visualization session
- Join a running visualization session
- Upload on of your dataset on the server for web visualization (Only if the administrator did allow you to do so)
Create a new visualization session
In order to create a new visualization session, you should fill the form provided on the left side of the page.
- The session name is used to humanly identified your session in the administration backend service.
- The data to load can either be a state or a data file stored on the server in a custom directory. This combobox get automatically populated regarding the content of those directories (Data and State).
- The ParaView setting is used to select a given configuration that the server administrator is providing such as using directly ParaView on the web server, or making some automatic remote connection for parallel rendering or using the Manta ray tracer engine.
- The Connect to field can be used to connect to any manually started remote pvserver. By default, their is no point to change it.
Then to finally create this remote session just click on the Create session icon. By doing that, the user should be redirected to another web page that will provide a 3D rendering view and all the control panel for applying a pre-defined set of filters and customized them.
Join a running visualization session
To join a running session, the user should fill the form with the session id that another user would have provide by looking at the information tab of a running session. The following image highlight the location of that session id.
Upload a data file
Depending on the configuration file that the administrator used to deploy the service, the user might be allowed to upload any file in the data directory of the server.
The uploaded file can be rejected if they are bigger than expected or if they not follow the extension that they are supposed to have. Moreover, after a certain amount of time, they can be removed automatically after a timeout that has to be defined by the server administrator.
Once a file has successfully uploaded, it will be available in the Data to load combobox field of the session creation area.
Process your data
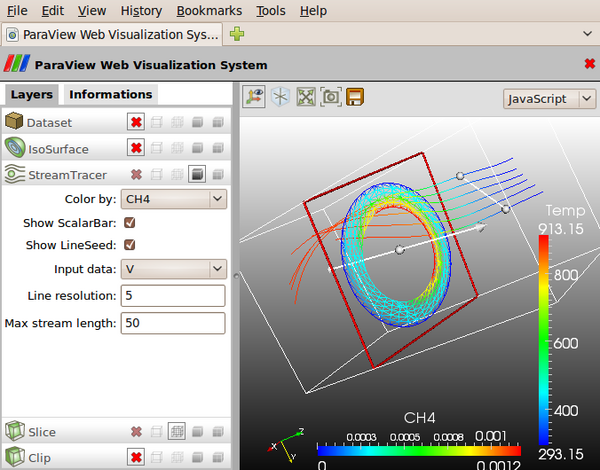
The PWApp interface is divided in 3 sections.
- Header (Top)
- Logo + Title
- Progress bar when needed
- Quit button
- Control panel (Left)
- Embed all the control on the processing filters and their representations.
- Embed the data informations
- View (Center)
- Embed a toolbar
- 3D render view.
In the control panel the user can switch ON any filter by choosing any available representation (Outline, Wireframe, Surface, Surface with edges) or switching OFF by choosing to hide a given filter (Red cross in the Stack header). If the panel of a given filter is not collapse, the user can ...
- choose which color mapping should be used.
- Show or hide the selected color mapping scalar bar
- Show of hide the 3D interactive widget when available
- Change some filters parameters
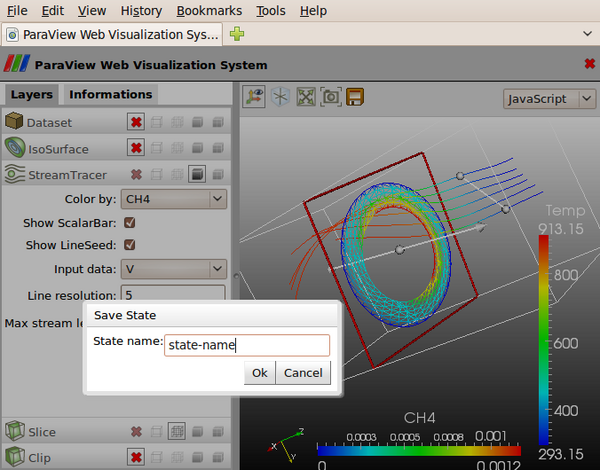
In the view toolbar, the user can reset the camera position to see the whole object and recenter the rotation center as well as showing/hiding rotation center and orientation axis. Moreover, the rendering image can be saved as well as saving the paraview state.
Save the result
The result can be saved as a capture image of the rendering view or as a state which can be loaded later with the Data to load field of the session creation form.
- To save the capture, just click on the camera that lies in the view toolbar. Once done, a new window/tab will appear with only a png image in it which could be saved with the browser menu.
- To save the state, just click on the floppy disk icon. A dialog will appear and ask you what name you want for your state.


