Advanced Multiblock: Difference between revisions
From KitwarePublic
Jump to navigationJump to search
(New page: =Introduction= This tutorial covers multiblock processing and data analysis. ==Multiblock - Color two blocks differently== *Color two blocks differently *Open the dataset can.exo. Turn o...) |
No edit summary |
||
| Line 22: | Line 22: | ||
*Go to the first frame, then Animate. | *Go to the first frame, then Animate. | ||
[[Image:advanced_multiblock_1.png|800px]] | |||
==Multiblock – Select a range of blocks== | ==Multiblock – Select a range of blocks== | ||
| Line 32: | Line 34: | ||
*Go back to the Object Inspector, and turn off blocks 122, 123, 124, 125, 126 and 127. Accept. | *Go back to the Object Inspector, and turn off blocks 122, 123, 124, 125, 126 and 127. Accept. | ||
*Notice that you can use the <shift> key to turn on and off groups of blocks. | *Notice that you can use the <shift> key to turn on and off groups of blocks. | ||
*(The picture below only has blocks 125, 126 and 127 turned off.) | |||
[[Image:advanced_multiblock_2.png|800px]] | |||
| Line 50: | Line 55: | ||
*Extra Credit – Try the same selection steps with cell type data. For a cell number, try Composite ID 2, cell 100. | *Extra Credit – Try the same selection steps with cell type data. For a cell number, try Composite ID 2, cell 100. | ||
[[Image:advanced_multiblock_3.png|800px]] | |||
==Data Analysis - Spreadsheet and histogram view== | ==Data Analysis - Spreadsheet and histogram view== | ||
| Line 67: | Line 75: | ||
[[Image:advanced_multiblock_4.png|800px]] | |||
==Data Analysis - Extract Selection== | ==Data Analysis - Extract Selection== | ||
| Line 78: | Line 87: | ||
*Try animating the data. | *Try animating the data. | ||
*Extra Credit: Turn on visibility of the can, and display it in wireframe. Change the color of the selected cell to Red. (The following picture is including the extra credit.) | *Extra Credit: Turn on visibility of the can, and display it in wireframe. Change the color of the selected cell to Red. (The following picture is including the extra credit.) | ||
[[Image:advanced_multiblock_5.png|800px]] | |||
=Acknowledgements= | =Acknowledgements= | ||
Sandia is a multiprogram laboratory operated by Sandia Corporation, a Lockheed Martin Company, for the United States Department of Energy’s National Nuclear Security Administration under contract DE-AC04-94AL85000. | Sandia is a multiprogram laboratory operated by Sandia Corporation, a Lockheed Martin Company, for the United States Department of Energy’s National Nuclear Security Administration under contract DE-AC04-94AL85000. | ||
Revision as of 02:07, 17 December 2008
Introduction
This tutorial covers multiblock processing and data analysis.
Multiblock - Color two blocks differently
- Color two blocks differently
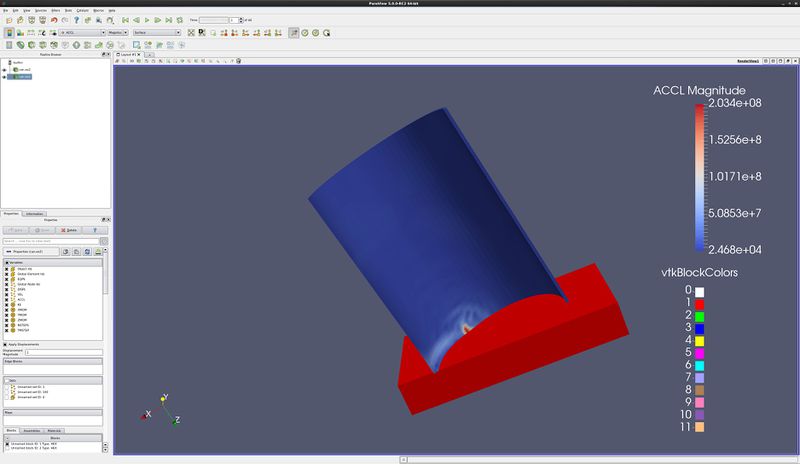
- Open the dataset can.exo. Turn on all variables. Apply.
- Block 0
- Be sure that can.exo is selected in the Pipeline Browser.
- Filters/ Alphabetical/ Extract Block.
- Select Dataset 0.
- Color by ACCL
- Block 1
- Be sure that can.exo is selected in the Pipeline Browser.
- Filters/ Alphabetical/ Extract Block.
- Select Dataset 1.
- Color by Displ
- Go to the last frame.
- Select ExtractBlock1 in the Pipeline Browser.
- Rescale to dataRange
- Select ExtractBlock2 in the Pipeline Browser.
- Rescale to dataRange
- Go to the first frame, then Animate.
Multiblock – Select a range of blocks
- Edit/ Delete All
- Open the dataset bake.exo. Turn on all variables. Apply.
- Open the Selection Inspector. (View/ Selection Inspector)
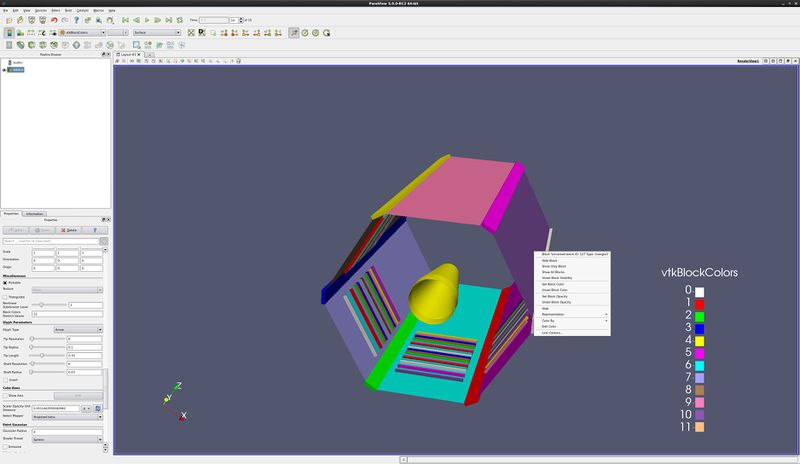
- Hold down the control key, and Select Block for the six outside blocks of bake.
- Scroll down the list of datasets (blocks) in the Selection Inspector. Notice that we have selected 122, 123, 124, 125, 126 and 127.
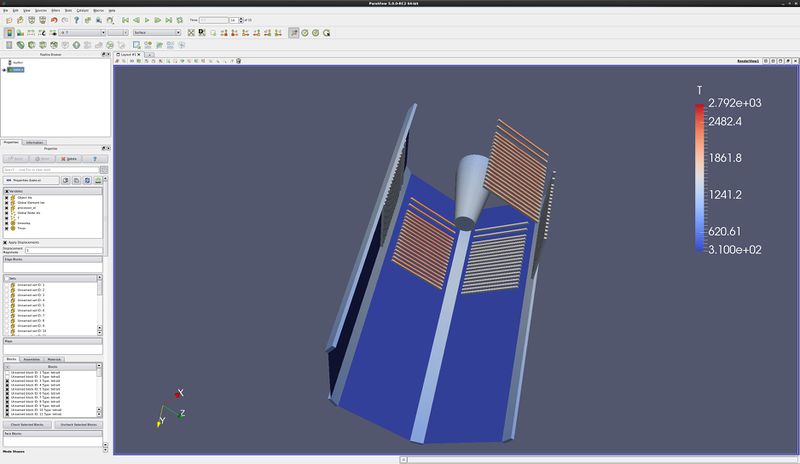
- Go back to the Object Inspector, and turn off blocks 122, 123, 124, 125, 126 and 127. Accept.
- Notice that you can use the <shift> key to turn on and off groups of blocks.
- (The picture below only has blocks 125, 126 and 127 turned off.)
Data Analysis - Point Labels
- Open the data set can.exo.
- Change the Style Representation to Surface With Edges.
- On the toolbar, push the Select Points On icon. This will allow you to manually select a point on your data set and have the id of those points displayed.
- Rubber band select a point (node)
- From the View menu select the menu option Selection Inspector.
- Notice that all of the point indexes are listed.
- On the Selection Inpector panel, scroll down to the bottom and click on the Point Label tab. Check the Visible check box. This will display the point IDs on the data set.
- You can also do a lookup in the opposite direction.
- On the Selection Inspector panel, scroll to the top and enter an Index Range or Global ID Range number. On can.exo, an example is Composite ID 2 (first generic block), and point 100. It will display on your dataset.
- Try toggling the Select Cells that Include the Selected Point on.
- HINT – change to wireframe to find the points or cells you have selected.
- Extra Credit – Try the same selection steps with cell type data. For a cell number, try Composite ID 2, cell 100.
Data Analysis - Spreadsheet and histogram view
- Open Can.exo.
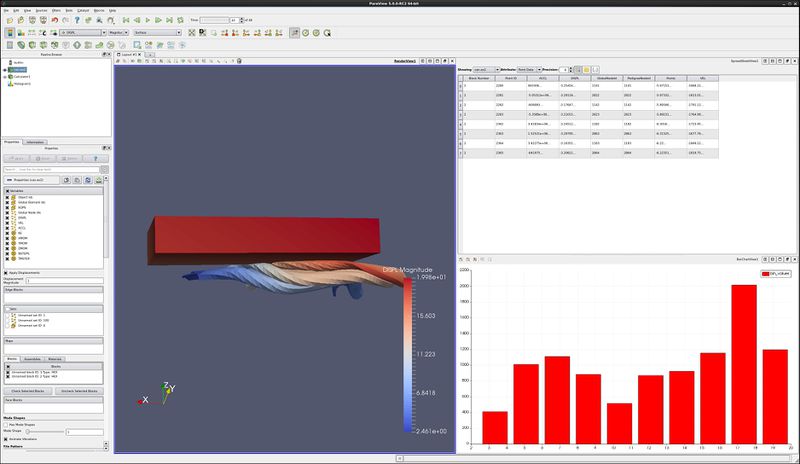
- Split Horizontal
- Split Vertical
- Highlight the can window, and select a cell on the can.
- In the upper right window, select Spreadsheet View.
- Select the Display tab, and change the Select Attributes to Show to Cell Data. Return it to Point Data.
- Select the Show Only Selected Elements check box.
- Select a different cell on the can.
- Highlight the lower right window.
- Filters→Data Analysis→Histogram. Apply.
- Change Scalars to DISPL. Apply.
- Animate forward in time one step at a time.
- Play
Data Analysis - Extract Selection
- Open can.exo.
- On the toolbar, push the Select Cells On icon. This will allow you to manually select a cell on your data set.
- Click on the can in one location, turning on only one cell.
- Filters→Data Analysis→Extract Selections, then click the Copy Active Selection button, and Apply.
- Split Vertical, Spreadsheet View, and turn on the eyeball in front of the ExtractSelection filter.
- You can see Cell data by selecting the ExtractSelection→Display tab and changing the Select Attributes to Show.
- Try animating the data.
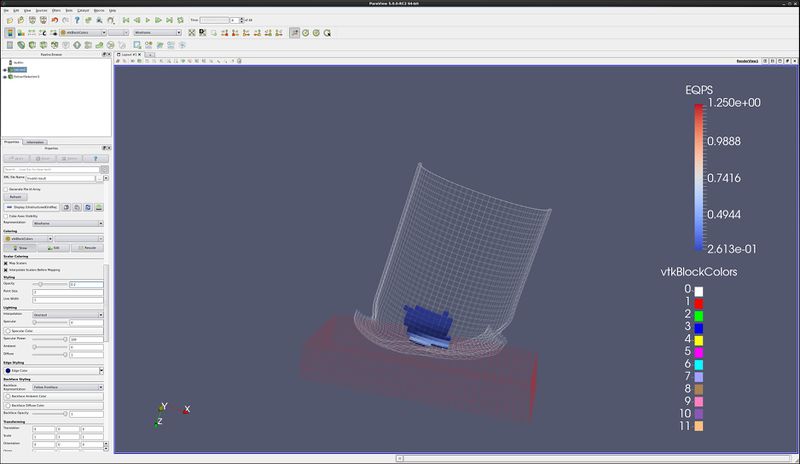
- Extra Credit: Turn on visibility of the can, and display it in wireframe. Change the color of the selected cell to Red. (The following picture is including the extra credit.)
Acknowledgements
Sandia is a multiprogram laboratory operated by Sandia Corporation, a Lockheed Martin Company, for the United States Department of Energy’s National Nuclear Security Administration under contract DE-AC04-94AL85000.
