VES/Screenshots: Difference between revisions
From KitwarePublic
< VES
Jump to navigationJump to search
| Line 19: | Line 19: | ||
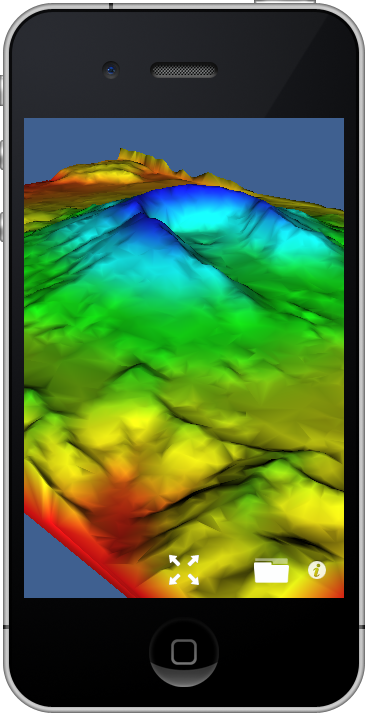
[[Image: KiwiViewer_MountStHelens.png|thumb|center|800px|Mount St. Helens visualization, terrain colored by elevation. ]] | [[Image: KiwiViewer_MountStHelens.png|thumb|center|800px|Mount St. Helens visualization, terrain colored by elevation. ]] | ||
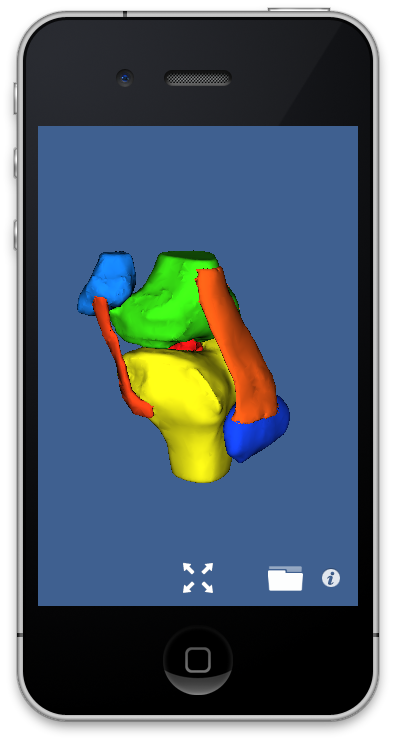
[[Image: KiwiViewer_Knee.png|thumb|center|800px|NAMIC knee atlas rendered in KiwiViewer ]] | [[Image: KiwiViewer_Knee.png|thumb|center|800px|NAMIC knee atlas rendered in KiwiViewer ]] | ||
Revision as of 22:44, 19 January 2012
Introduction
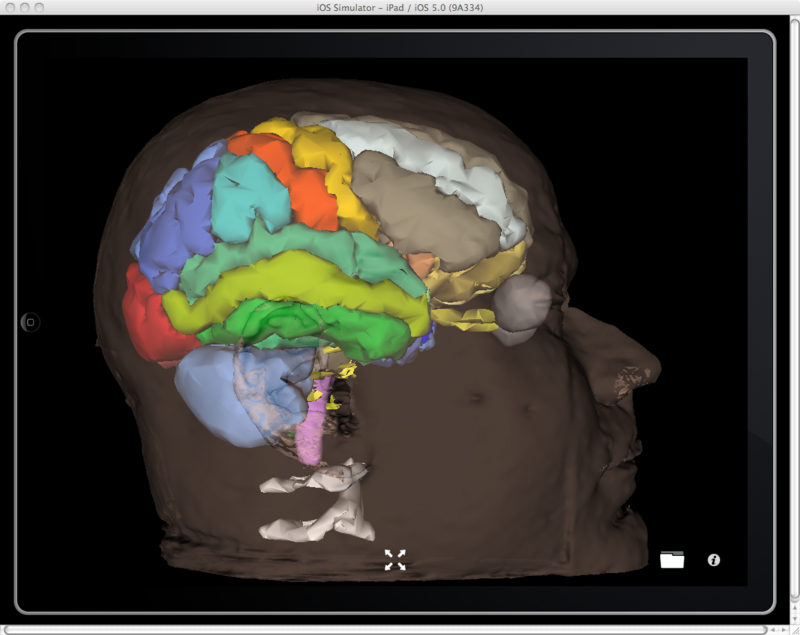
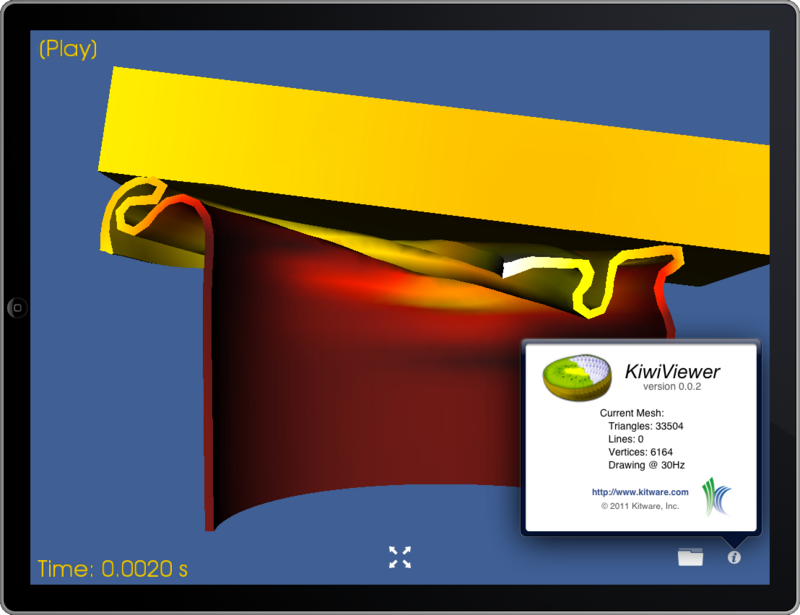
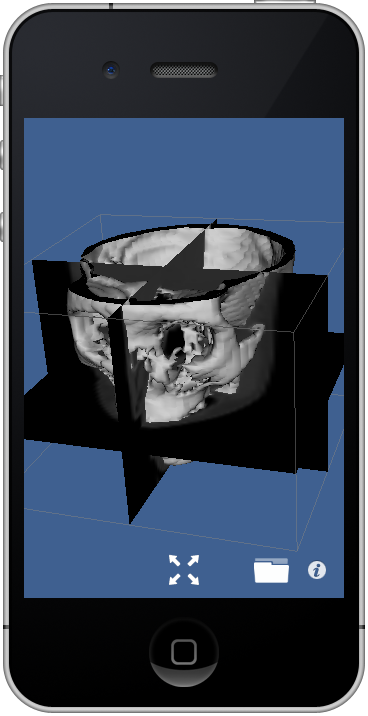
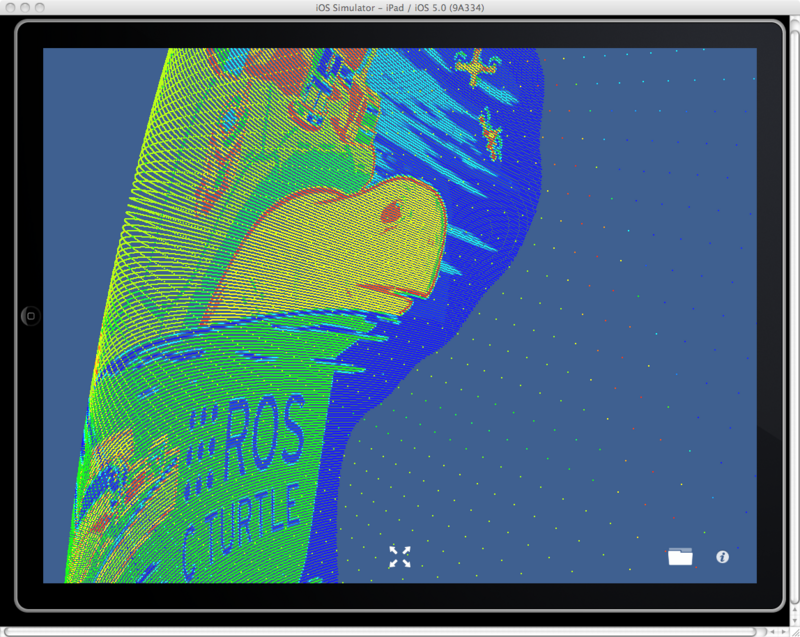
The following screenshots depict visualizations produced using the VES rendering library. The visualizations run on Android and iOS devices, but the screenshots are captured using the iPhone/iPad simulator.
Screenshots
